Tencent Stock Technicals Today: Drops 6.08%, Golden Cross Formed
On Juli 24, 2026: price 445.20 HKD, trend sideways, RSI 44.8, support 411.80, resistance 484.00. technical analysis of tencent stock. Tencent Stock Technicals…

Tencent Holdings fell on the Hong Kong exchange on 22 July 2026, with 0700.HK last changing hands at 445.20 HKD, down 6.08% on the day and back below the short-term averages, a move that signals a market still willing to trade the stock but not yet ready to reward it with sustained upside.
The drop matters less as a single-day number than as a message. Tencent is sitting in the middle of a broad range, but the tape is telling a mixed story: the shares are below SMA20 at 451.05 while the SMA20 remains above SMA50 at 450.30, a so-called golden cross that usually points to improving medium-term structure. In plain language, that means the longer trend is trying to turn constructive, yet the latest price action is still leaning against it. The stock is also 46% through the 20-hour range, which is not a breakdown, but it is far from a position of strength.
That tension is exactly what the chart shows.
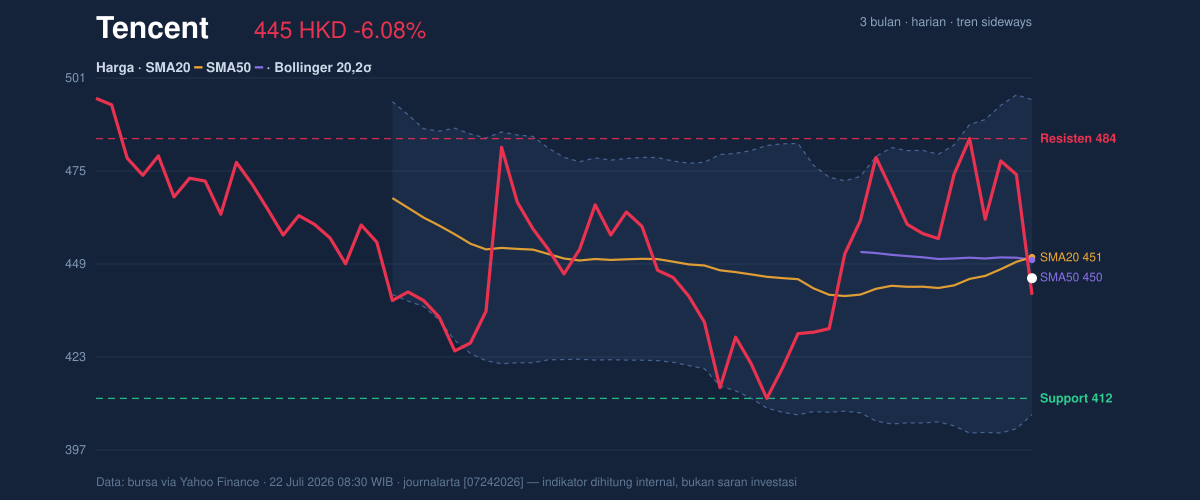
Trend & Price Action
Tencent’s broader setup is best described as sideways, with the SMA20 slope at 1.77% over 5 days. That slope is important: it shows the short-term average is still edging higher, which can be an early sign of stabilization after a pullback. But because the market price is now under the SMA20, the signal is incomplete. Traders often watch that relationship closely because it tells them whether momentum is confirming the trend or resisting it. Here, the trend is trying to firm up, but the latest move says buyers have not fully defended the line.
The Bollinger Bands add more context. With the middle band at 451.05 and the lower band at 407.25, Tencent is trading below the center of its recent volatility envelope, while %B at 43% suggests price is neither stretched to the downside nor pressing the upper band. The 19.4% band width is described as normal, so this is not a squeeze that typically precedes a dramatic breakout. It looks more like a stock in consolidation, where direction will likely be decided by whether the market can reclaim the mid-band and then work toward the upper band at 494.85.
Short version: the trend is not broken, but it is not convincing.
Oscillators & Momentum
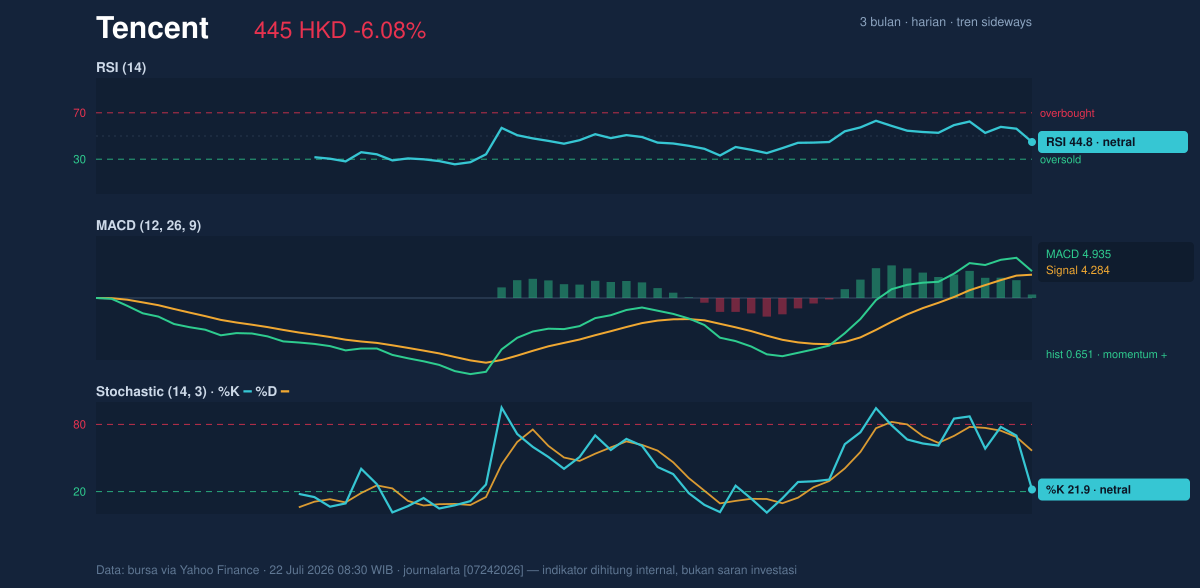
The oscillators are more balanced than the price action. RSI at 44.8 is neutral, which means Tencent is not oversold enough to automatically attract bargain-hunting, nor overbought enough to warn of exhaustion. That matters because it suggests the recent drop has room to continue, but it does not yet look like a panic move. The Stochastic %K at 21.9 versus %D at 56.6 is more interesting: %K sitting well below %D indicates short-term momentum has weakened faster than the slower signal line, often a sign that the stock is still digesting its decline. Yet because the reading is still classed as neutral, this is more of a cooling phase than a clean reversal setup.
The one bullish counterweight is the MACD at 4.935 above the signal line at 4.284, with a positive histogram of 0.651. MACD measures whether the stock’s recent pace is improving or deteriorating. Here, it says the underlying momentum is still positive even as price has slipped below the moving average. That divergence is important: it suggests the selloff may be more of a pullback inside a larger attempt to stabilize, not a full trend collapse. But momentum that does not show up in price can fade quickly if support gives way.
Volatility & Volume
Tencent’s ATR(14) of 20.83, equal to 4.7% of price, points to high volatility. ATR is a measure of how much a stock typically moves in a day, so this reading tells readers to expect wider swings than a quiet blue-chip name would normally produce. That volatility is reinforced by the day’s trading volume: 66,379,871 shares versus a 20-hour average of 37,826,798, or 1.8× normal activity. In practical terms, the market is engaged. This is not a sleepy drift lower; it is a move being actively traded.
But volume alone does not settle the question. OBV is down, and that is the caution flag. On-balance volume tries to show whether money is accumulating or leaving the stock by tracking volume direction alongside price. A falling OBV while price is soft says distribution is still a risk: more shares may be changing hands on down days than on constructive ones. That is why the volume spike should not be read as automatic confirmation of strength. It confirms participation, not conviction.
Key Levels & Scenarios
The nearest map is clear. Support sits at 411.80 on the 20-hour view, very close to the 3-month low of 411.00. That alignment makes this zone especially important: if the stock tests it again, the market will likely treat it as a make-or-break area. On the upside, resistance is 484.00, with the Bollinger upper band at 494.85 just above it and the 3-month high at 502.00 beyond that. This creates a layered ceiling: first the resistance, then the upper band, then the recent high.
If Tencent can regain 451.05 and hold above it, the chart would start to look more constructive because price would be back above the Bollinger midline and the short-term average. If it fails to hold 411.80, the market would be probing the 3-month low area, and the current sideways structure would lose much of its credibility.
Technical Verdict: HOLD (wait & see)
HOLD (wait & see)
- MACD remains positive with the histogram above zero, so the broader momentum has not fully rolled over.
- Price is below SMA20 even though the chart still shows a golden cross, which is a mixed signal rather than a clean trend.
- Volume is 1.8× average, but OBV is down, so participation is high without clear accumulation confirmation.
Verdict invalidated if price falls below 411.80.
- Ideal entry range: 411.80 to 451.05
- Exit target: 484.00 to 494.85
- Stop loss protection: below 407.25, with 411.00 as the nearby structural reference
For non-traders: Tencent is not trending cleanly enough to call it strong, but it is not weak enough to dismiss either.
“The market is still debating whether this is a pause or the start of something bigger.”
Summary Data Tencent
| Last price | 445.20 HKD |
| Change 1 day / 5 days / 1 month | -6.08% / -6.08% / 7.33% |
| Trend / MA-cross | sideways / golden |
| SMA20 / SMA50 | 451.05 / 450.30 |
| RSI (14) / Stochastic %K | 44.8 / 21.9 |
| Bollinger %B / ATR | 43% / 20.83 |
| Support / Resistance 20 days | 411.80 / 484.00 |
| Data as of | 22 Juli 2026 08:30 WIB |


