Alibaba Stock Drops 4.26%, Momentum Gains In Focus
On Juli 27, 2026: price 110.00 HKD, trend sideways, RSI 49.7, support 89.50, resistance 117.00. technical analysis of alibaba stock. Alibaba Stock Drops — full…

Alibaba Group’s Hong Kong-listed shares fell to HKD 110.00 on the Hong Kong exchange on 24 July, slipping 4.26% from the previous close as traders weighed a still-positive medium-term technical setup against a sharp one-day pullback. The move leaves the stock above its SMA20 at 105.90 but below its SMA50 at 113.66, a split that usually signals a market in transition rather than one with a clean directional conviction. The chart shows a name that is not breaking down, but is also not yet reclaiming full trend control.
Trend & Price Action
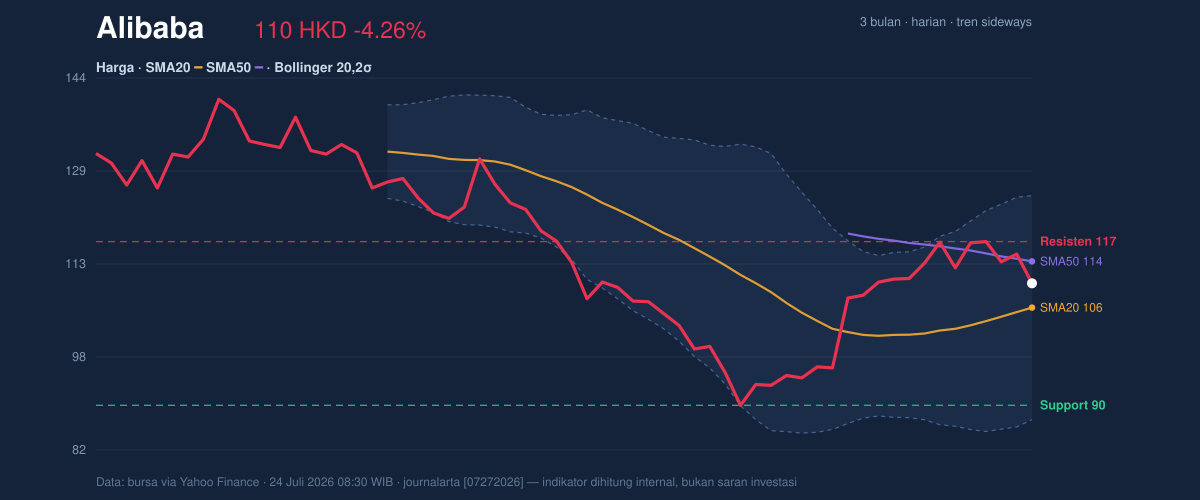
Alibaba remains in a sideways trend, though the SMA20 is rising at 3.48% over 5 days, which matters because a rising short-term average often means recent buyers are still willing to defend dips even when price is choppy. That said, the stock is still trading below the SMA50, so the medium-term picture has not fully turned up. In plain language: the market is trying to stabilize, but it has not yet proven that the latest bounce can extend into a sustained re-rating.
The broader range also frames the move. The stock is sitting well above the 3-month low of 88.65 and still below the 3-month high of 144.00, with the current price positioned at about 75% of the 20-day range between support at 89.50 and resistance at 117.00. That placement is important: it tells us the share price is closer to the upper half of its recent operating band, but not yet at the ceiling where momentum usually gets tested.
The lack of a fresh moving-average crossover also argues for patience.
It is a market waiting for confirmation.
Oscillators & Momentum
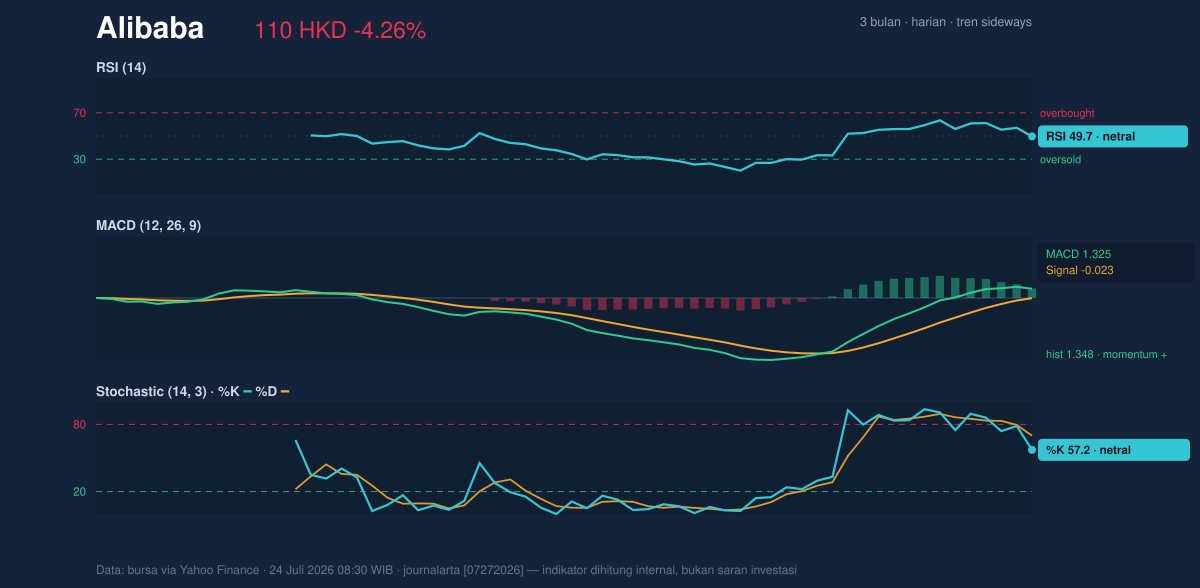
Momentum is mixed, which fits the sideways trend. The RSI at 49.7 is essentially neutral, meaning the stock is neither overbought nor oversold. That is not exciting, but it is constructive: it suggests the recent decline has not yet pushed the shares into a technical exhaustion zone. The Stochastic reading of 57.2 versus 69.9 is also neutral, though it is softer than the RSI and hints that near-term upside may need fresh buying interest to keep going.
The cleaner signal comes from MACD, which is positive at 1.325 with the signal line at -0.023 and a histogram of 1.348. For non-specialists, MACD is a trend-following gauge: when it sits above its signal line and the histogram is positive, it usually means momentum is still tilted upward even if price has paused. That matters here because the stock’s one-day drop does not yet show up as a full momentum breakdown.
So the message from oscillators is simple: the pullback looks like a pause, not a reversal.
But pauses can become reversals if support gives way.
Volatility & Volume
The Bollinger Bands show the stock in a more energetic phase than the RSI alone might imply. The upper band is 124.72, the middle band is 105.90, and the lower band is 87.09, with %B at 61%. That means price is trading in the upper portion of the band structure, closer to the recent average than to the top, while still maintaining room to move before reaching the upper boundary. More importantly, the band width is 35.5% and is expanding, which signals rising volatility. Expanding bands often precede larger price swings, so the current calm may be temporary.
The ATR at 6.15, or 5.6% of price, reinforces that point. ATR measures typical daily movement, and a higher reading means wider intraday and day-to-day swings are likely. In practical terms, a move of several Hong Kong dollars in either direction would not be unusual.
Volume, however, is a little less convincing. Last trade volume was 107,488,512, below the 20-day average of 120,924,208, or about 0.9x normal. That suggests the latest drop did not come with a surge in participation, which reduces the odds that the move was a decisive institutional exit. At the same time, OBV is rising, and that is the more interesting clue: on-balance volume tracks whether volume is accumulating on up days or being lost on down days. Rising OBV while price is still range-bound often means underlying demand has not disappeared even if the headline candle looks weak.
That is not a breakout signal. It is a warning not to overread one red day.
Key Levels & Scenarios
The immediate technical map is fairly clear. Support sits at 89.50, then the lower Bollinger band at 87.09. On the upside, the first hurdle is resistance at 117.00, followed by the upper Bollinger band at 124.72 and then the SMA50 at 113.66, which is now acting as a nearby trend checkpoint. If price can reclaim and hold above the SMA50, it would strengthen the case that the recent weakness was only a retracement within a broader recovery. If it fails to hold the 105.90 middle band/SMA20 area, the market would likely revisit the lower half of the range more quickly than bulls would prefer.
Technical Verdict: HOLD (wait & see)
HOLD (wait & see)
- MACD is positive and the histogram remains above zero, which argues that underlying momentum has not fully rolled over.
- RSI at 49.7 and Stochastic at 57.2 / 69.9 are neutral, so there is no strong overbought or oversold signal to force a directional call.
- Bollinger bands are expanding and ATR is elevated, meaning the next move could be larger, but the stock has not yet confirmed direction with a clean break above resistance or below support.
Verdict invalidated if price falls below 89.50, which would expose the lower Bollinger band at 87.09 and weaken the current recovery structure.
- Ideal Entry Range: 105.90 to 110.00
- Exit Target (Target Price): 117.00 to 124.72
- Stop Loss protection: below 89.50
In plain English, the stock is not weak enough to look broken, but not strong enough yet to call a fresh advance.
Latest fact: volume was 107,488,512 versus a 20-day average of 120,924,208.
Summary Data Alibaba
| Last price | 110.00 HKD |
| Change 1 day / 5 days / 1 month | -4.26% / -2.31% / 15.79% |
| Trend / MA-cross | sideways / none |
| SMA20 / SMA50 | 105.90 / 113.66 |
| RSI (14) / Stochastic %K | 49.7 / 57.2 |
| Bollinger %B / ATR | 61% / 6.15 |
| Support / Resistance 20 days | 89.50 / 117.00 |
| Data as of | 24 Juli 2026 08:30 WIB |


