BP Stock Drops 1.35%, Testing Key Resistance In Focus
On Juli 27, 2026: price 548.40 GBp, trend sideways, RSI 65.9, support 455.60, resistance 555.90. technical analysis of bp stock. BP Stock Drops — full details…

BP plc is trading close to the top of its recent range, and that matters because the stock is now being judged less on direction than on whether momentum can keep stretching without triggering a pullback.
At 548.40 GBp, BP shares fell 1.35% on the day after a 6.05% rise over five days and a 16.83% gain over one month, according to the London Stock Exchange data published via Yahoo Finance at 24 July 2026 14:00 WIB. The message is straightforward: the trend is still constructive, but the stock is entering the part of the chart where gains often become harder to extend. That is especially true when price is already sitting near the upper end of a range, as shown in the chart.
Trend & Price Action
BP is still in a sideways trend, but it is not a flat one. The SMA20 at 498.82 is rising, with a 2.74% slope over five days, and the share price remains above the SMA20 and above the SMA50 at 515.76. That alignment tells investors the recent upswing has been strong enough to pull price above both short- and medium-term averages, which is usually a sign that sellers have not yet regained control.
There is, however, no new MA-cross, meaning the chart has not delivered a fresh moving-average crossover to confirm a new trend regime. In plain English, the stock has improved, but it has not yet produced the kind of clean technical break that would suggest a sustained new leg higher. The price is also at 93% of its 20-hour range, with support at 455.60 and resistance at 555.90. That placement near the top of the range often signals a market that is efficient on the upside, but also vulnerable to profit-taking if buyers pause.
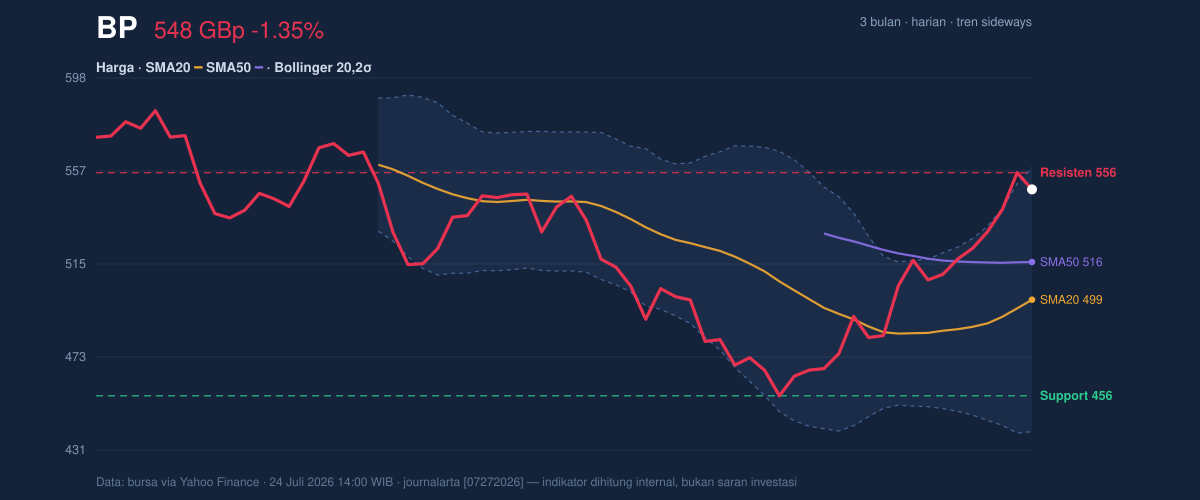
The broader backdrop is equally important. BP is trading below its 3-month high of 592.00 but comfortably above the 3-month low of 450.60. That puts the stock in the upper half of its recent trading band, which supports the view that the market has repaired earlier weakness without yet breaking into a fresh breakout zone.
Oscillators & Momentum
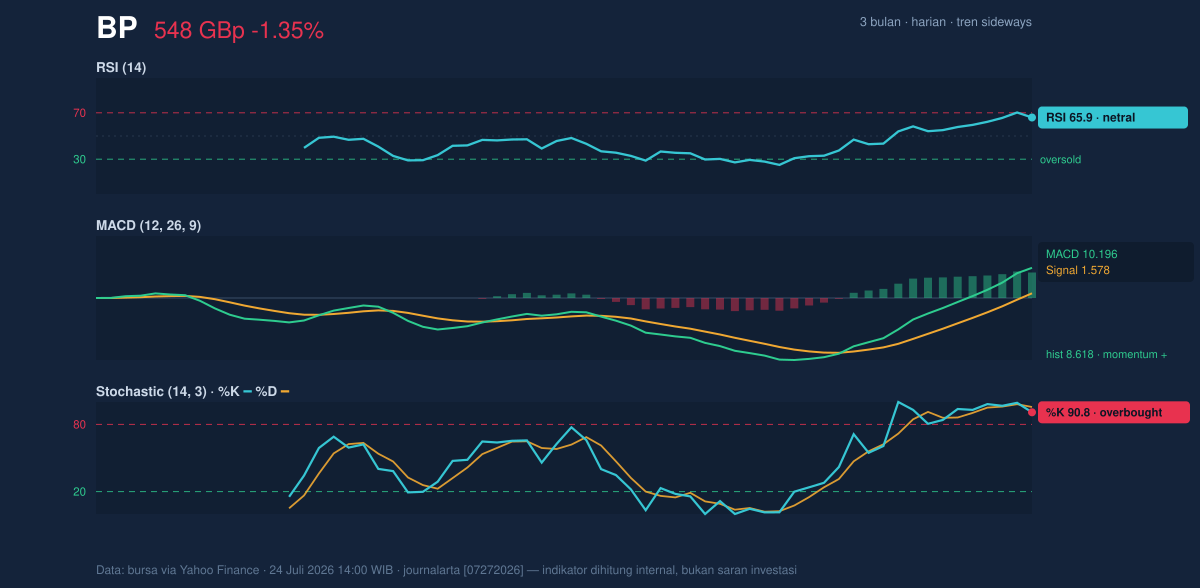
Momentum is mixed, and that is the key nuance in this chart. The RSI at 65.9 is still described as neutral, which means the stock is not yet in a classic overbought warning zone. But the Stochastic %K at 90.8 and %D at 95.5 are both overbought, showing that price has climbed quickly relative to its recent trading history. When Stochastic readings are this elevated, the market is often stretched even if the broader trend remains positive.
The MACD at 10.196, above its signal line at 1.578, with a histogram of 8.618, points the other way: momentum is still positive and widening. That combination matters. It suggests buyers remain in charge, but they are doing so in a market that is already extended on some shorter-term measures. In other words, the chart is not screaming reversal, but it is warning that the pace of the advance may be harder to maintain without a pause or consolidation.
Volatility & Volume
Volatility is increasing rather than contracting. BP’s Bollinger Bands are widening, with the upper band at 558.17, the middle band at 498.82, and the lower band at 439.47. A wider band usually means the market is expecting larger price swings, and the current %B of 92% shows the share price is pressing very close to the top band. That is often where rallies become more sensitive to bad news, sector rotation, or simple exhaustion.
The ATR(14) at 13.73, equal to 2.5% of price, confirms moderate volatility. This is not a calm chart, but it is also not a disorderly one. Volume adds a useful confirmation: the latest turnover of 43,536,954 was about 1.1× normal versus the 20-hour average of 37,874,893, and OBV is rising. That combination suggests the move has real participation behind it rather than being driven by thin trading. Rising OBV is especially important because it indicates accumulation: more volume has been flowing into up days than down days.
Key Levels & Scenarios
The immediate technical map is clear. Resistance at 555.90 is the first obvious ceiling, and the upper Bollinger band at 558.17 sits just above it, reinforcing that zone as a likely test area. A sustained move through that cluster would open the way toward the broader 3-month high at 592.00. On the downside, support at 498.82 — which is also the SMA20 and Bollinger middle band — is the first important line to watch. If that fails, the next layer of protection sits at the lower Bollinger band at 439.47, with the recent 3-month low at 450.60 marking the nearby historical floor.
Because price is already near the top of its range and Stochastic is overbought, the chart is more sensitive to disappointment than it is to surprise. If BP can keep closing above the mid-band and challenge resistance, the current move stays intact. If it slips back through the SMA20, the recent rally starts to look more like an overextended rebound than a breakout.
Technical Verdict: HOLD (wait & see)
HOLD (wait & see) — the trend is constructive, but the stock is stretched near resistance and the short-term oscillator setup is overbought.
- Reason 1: MACD is positive and the histogram is strong, which confirms upward momentum is still present.
- Reason 2: Price is above SMA20 and SMA50, showing the recent recovery remains technically intact.
- Reason 3: Stochastic is overbought and price is at 92% of the Bollinger range, which raises the risk of near-term consolidation.
- Invalidation: This verdict is invalidated if price falls below 498.82, the SMA20 and Bollinger middle band.
- Ideal Entry Range: 498.82 to 515.76
- Exit Target (Target Price): 555.90 to 558.17
- Stop Loss protection: 455.60
In plain English, BP is still behaving better than it was a month ago, but the chart now looks like it needs a breather before the next meaningful move.
The next technical test is whether the shares can hold the 498.82 area while they press against 555.90 and the 558.17 upper band.
Summary Data BP
| Last price | 548.40 GBp |
| Change 1 day / 5 days / 1 month | -1.35% / 6.05% / 16.83% |
| Trend / MA-cross | sideways / none |
| SMA20 / SMA50 | 498.82 / 515.76 |
| RSI (14) / Stochastic %K | 65.9 / 90.8 |
| Bollinger %B / ATR | 92% / 13.73 |
| Support / Resistance 20 days | 455.60 / 555.90 |
| Data as of | 24 Juli 2026 14:00 WIB |

