HSBC Stock Technicals Today: Drops 0.06%, RSI Overbought
On Juli 27, 2026: price 161.40 HKD, trend uptrend, RSI 74.1, support 147.60, resistance 161.50. technical analysis of hsbc stock. HSBC Stock Technicals — full…

HSBC Holdings is pressing right up against its near-term ceiling: 161.40 HKD, just below the 161.50 resistance line and within a whisker of the 162.00 three-month high, while the stock has gained 8.83% over the past month and 2.87% in the past five days. The message from the tape is straightforward: the trend remains constructive, but the stock is now extended enough that momentum is starting to look stretched rather than freshly powerful.
Trend & Price Action
The broader structure is still bullish. HSBC is trading above both the SMA20 at 153.96 and the SMA50 at 147.94, which tells you the shares are not just drifting higher but are doing so above their short- and medium-term trend lines. In practical terms, that means recent buyers are still in control and the market has been willing to pay up above the average price of the past 20 and 50 sessions. The SMA20 slope, at 1.78% over 5 days, reinforces that upward tilt.
What matters now is where price sits inside the range. At 161.40, HSBC is at 99% of the 20-hour range and only a fraction below the 161.50 resistance shown in the chart. That is usually where trend-following strength starts to face a test: if the stock cannot clear the ceiling, traders often see consolidation rather than immediate continuation. If it can, the next reference point is the 162.00 three-month high.
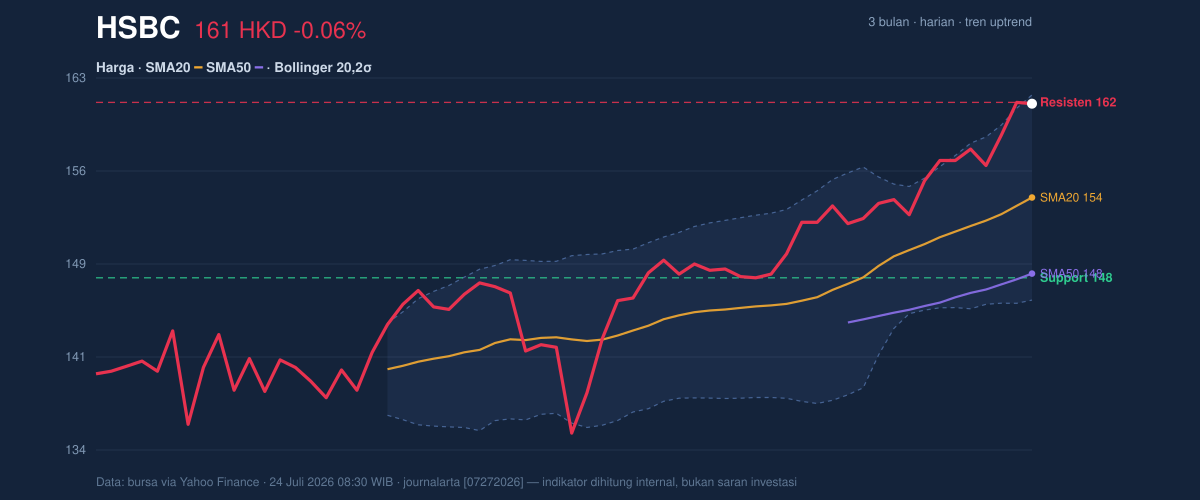
The chart shows a stock that has already done the hard work of climbing back above its moving averages. The question is no longer whether the trend is up — it is whether the market has enough energy left to push through the top of the recent range.
Oscillators & Momentum
Momentum indicators are still positive, but they are also flashing the classic warning signs of a crowded short-term move. The RSI at 74.1 is in overbought territory, which does not mean the stock must fall, but it does mean the pace of buying has been strong enough to leave less room for error. The Stochastic %K at 95.1 and %D at 97.0 are even more extreme, showing the stock is trading near the top of its recent band and may need a pause to cool off.
That said, the MACD at 3.597 remains above its signal line at 3.051, with a positive histogram of 0.546. In plain language, the trend engine is still running; the issue is not a bearish reversal signal, but a stretched setup where price has outpaced some of its momentum gauges. When MACD is positive while RSI and Stochastic are overbought, the usual reading is “strong trend, but vulnerable to a breather.”
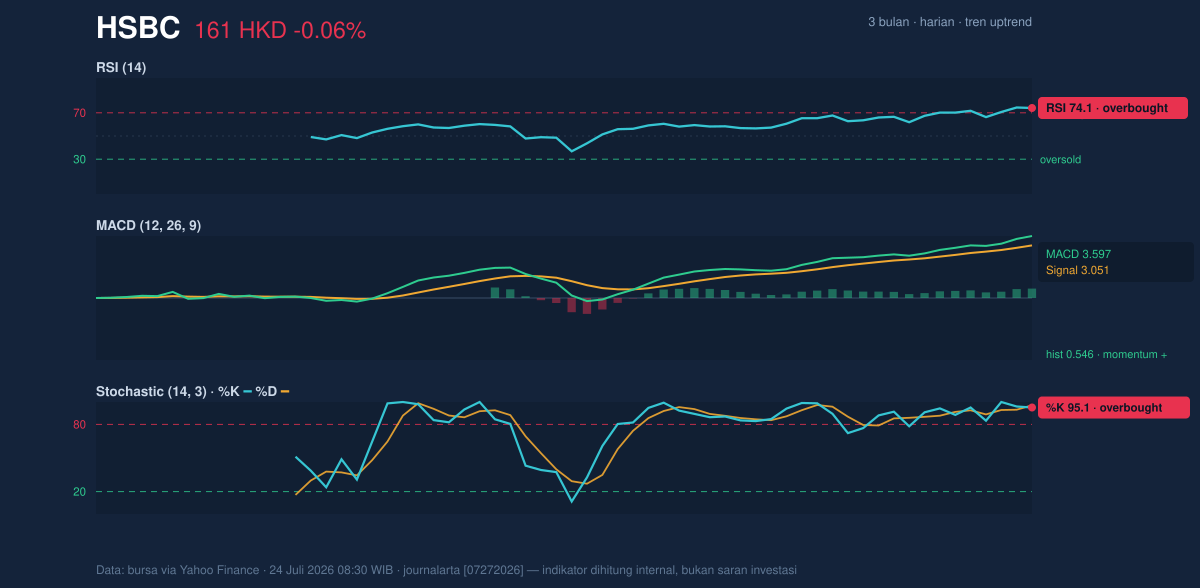
As shown in the momentum chart, the indicators are aligned in favor of the bulls, but they are no longer confirming fresh acceleration. That is a difference traders watch closely.
Volatility & Volume
Bollinger Bands add to the same picture. Price is sitting near the top band at 162.09, with %B at 96%. That means HSBC is trading very close to the upper edge of its recent volatility envelope. The band width is 10.6%, described as normal, so this is not a compression setup waiting for a violent expansion; instead, it suggests the stock has already moved meaningfully within an ordinary volatility regime.
ATR at 2.66, or 1.6% of price, points to moderate daily movement. That matters because it implies the stock can still swing enough to challenge resistance or pull back toward support without needing a dramatic market shock. Volume, however, is not confirming a decisive breakout attempt yet: the latest volume of 10,606,273 is only 0.8× the 20-day average of 13,921,820. In other words, the stock is near the top of its range, but it is doing so without unusually heavy participation.
The one encouraging volume-related detail is that OBV is rising. On-balance volume tracks whether volume is flowing into up days rather than down days, so a rising OBV suggests accumulation has been building under the surface even if the latest session was not especially busy. That can help explain why HSBC has held its trend.
Key Levels & Scenarios
The immediate battlefield is clear. 161.50 is the first resistance, followed by the 162.00 three-month high and the upper Bollinger band at 162.09. On the downside, the key support is 147.60, which also sits close to the lower end of the recent 20-hour range and above the 145.84 lower Bollinger band. The middle Bollinger line at 153.96 doubles as the SMA20, making it an important line of trend defense if price starts to retreat.
The setup suggests two conditional paths. If HSBC clears 161.50 with conviction, the chart opens the door to a move into new short-term highs above 162.00. If it fails there, the more likely next phase is a pullback toward the 153.96 area, where the stock would be retesting the average price of the past 20 sessions. A loss of 147.60 would do more damage to the current bullish structure and would imply the recent advance has stalled more meaningfully.
Technical Verdict: HOLD (wait & see)
HOLD (wait & see) fits best because the trend is still positive, but the stock is also stretched near resistance with overbought momentum readings.
- MACD remains positive above its signal line, so the trend is still intact.
- RSI at 74.1 and Stochastic at 95.1/97.0 show the move is overextended in the short term.
- Price at 161.40 is pressing against 161.50 resistance and near the 162.09 Bollinger upper band, so upside progress needs confirmation.
Verdict invalidated if price breaks below 147.60.
- Ideal Entry Range: 153.96 to 147.60
- Exit Target (Target Price): 161.50 to 162.00
- Stop Loss protection: below 147.60
For non-traders: HSBC is still in an uptrend, but it looks close to a short-term ceiling and may need to cool off before the next move.
Summary Data HSBC
| Last price | 161.40 HKD |
| Change 1 day / 5 days / 1 month | -0.06% / 2.87% / 8.83% |
| Trend / MA-cross | uptrend / none |
| SMA20 / SMA50 | 153.96 / 147.94 |
| RSI (14) / Stochastic %K | 74.1 / 95.1 |
| Bollinger %B / ATR | 96% / 2.66 |
| Support / Resistance 20 days | 147.60 / 161.50 |
| Data as of | 24 Juli 2026 08:30 WIB |


