RSI Overbought, DBS Stock Gains 0.60% Today
On Juli 27, 2026: price 73.94 SGD, trend uptrend, RSI 79.9, support 65.40, resistance 73.94. technical analysis of dbs stock. RSI Overbought — full details…

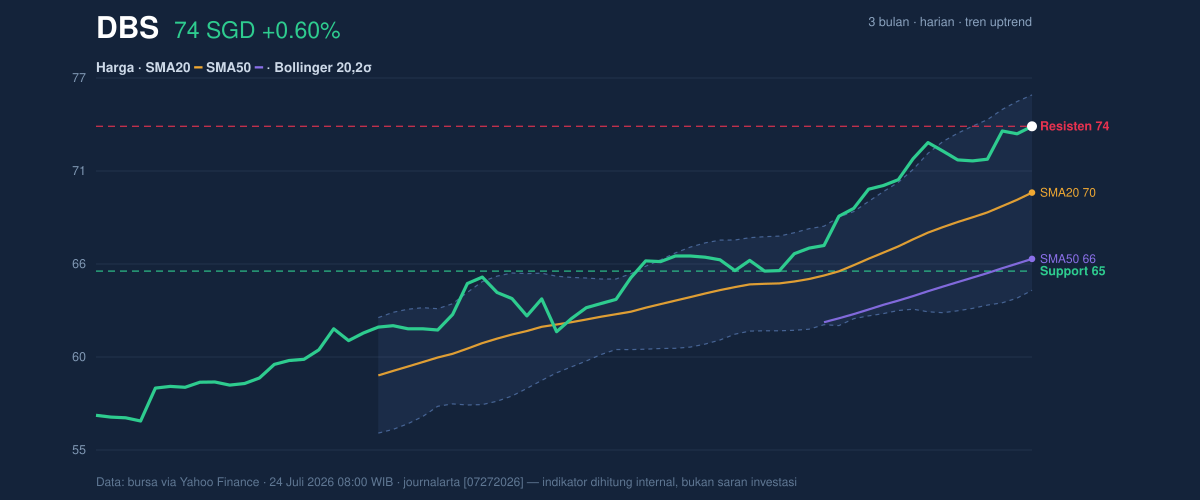
At 73.94 SGD, DBS Group is pressing against the top of its recent trading range, after a 0.60% one-day rise and a 13.01% gain over the past month, according to Singapore Exchange-linked market data cited via Yahoo Finance at 24 July 2026 08:00 WIB. The share is not just drifting higher; it is doing so with the price sitting above the SMA20 at 70.03 and well above the SMA50 at 66.12, which tells traders the medium-term trend remains firmly upward. But the move is no longer cheap in technical terms: momentum gauges are flashing overbought, meaning the stock has advanced fast enough that it may be vulnerable to pauses or pullbacks even while the broader trend stays intact.
Trend & Price Action
The structure is still constructive. DBS is in an uptrend, and the SMA20 is rising by 2.54% over five days, a useful sign that recent buying has been broad enough to lift the short-term average itself. When a price stays above both the short and medium moving averages, it usually means dips have been met by demand rather than rejected by it. That is reinforced by the fact that the stock is sitting at the 3-month high of 73.94, which also doubles as the current 20-hour resistance at 73.94. In plain language: DBS has already climbed to the ceiling of its recent range, so the next move depends less on trend direction and more on whether buyers can absorb overhead supply.
The absence of a new MA-cross matters too. There is no fresh moving-average crossover to signal a new acceleration phase; instead, the market is extending an already-established trend. That often produces steadier, less explosive advances. It also means the burden of proof now sits with the price itself. If the stock cannot stay above the upper edge of its range, the chart can quickly shift from breakout attempt to consolidation.
Oscillators & Momentum
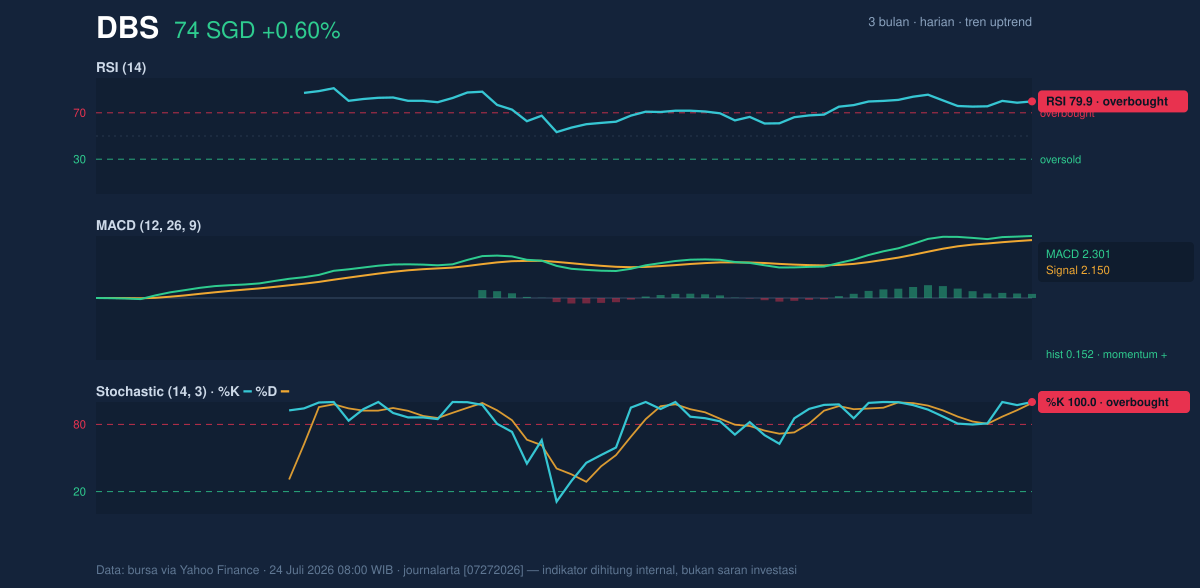
The momentum picture is where caution starts to rise. The RSI at 79.9 is firmly overbought, and the Stochastic at %K 100.0 / %D 99.1 is also pinned at extreme levels. Those readings do not mean the stock must fall immediately; they mean the recent pace of gains has been unusually strong and may be difficult to sustain without a pause. In technical terms, overbought conditions can persist in a strong trend, but they also increase the odds that any fresh upside needs new catalysts rather than just momentum carryover.
The one confirming signal is the MACD at 2.301, above its signal line at 2.150, with a positive histogram of 0.152. That setup says trend momentum is still pointing upward and has not yet rolled over. So the chart is not showing a full reversal warning; it is showing a market that is still advancing, but with oscillators stretched to the point where upside follow-through may become more selective.
That is the tension in the chart.
Volatility & Volume
Volatility is present, but not extreme. DBS’s ATR(14) of 1.28, equal to 1.7% of price, suggests the stock is moving enough to matter, yet not in a disorderly way. The Bollinger Bands add an important nuance: the upper band sits at 75.79, the middle band at 70.03, and the lower band at 64.27, with %B at 84% and band width at 16.4% described as normal. A %B reading this high means price is trading near the upper band, which often signals strength, but also warns that the stock is stretched within its current envelope. Because the band width is still normal rather than compressed, this is not a classic “squeeze” setup waiting to explode; it is more of a controlled climb already near the top of its corridor.
Volume is the one area that tempers enthusiasm. The latest turnover of 2,772,500 is only 0.7× the 20-hour average of 4,157,503. That means the latest push higher is not being backed by unusually heavy participation. In technical analysis, a rise on lighter volume can still work, but it often lacks the force needed to break cleanly through resistance. The good news is that OBV is rising, which suggests the broader flow of money has still been accumulating over time even if the most recent session was not a volume surge.
Key Levels & Scenarios
The chart shows DBS trading at the top of its 20-hour range from 65.40 to 73.94, with price effectively at 100% of the range. That leaves little room for error in the short term. The nearest visible ceiling is the upper Bollinger band at 75.79, while the first meaningful support sits at the Bollinger middle band and SMA20 at 70.03. Below that, the next reference is the lower Bollinger band at 64.27, close to the broader range floor at 65.40.
What this means in practice is straightforward: if DBS can hold above 70.03, the chart keeps its bullish structure and can remain in a trend-following mode. If it loses that level, the market would likely be signaling that the current stretch is cooling. A move through 75.79 would show buyers are still willing to pay up even with overbought momentum, but without stronger volume that move may be harder to sustain. The current setup is less about chasing a dramatic breakout and more about whether the stock can digest gains without breaking character.
Technical Verdict: HOLD (wait & see)
HOLD (wait & see) because the trend remains upward, but RSI at 79.9 and Stochastic at 100.0/99.1 show the stock is stretched, while MACD remains positive and OBV is rising, confirming the broader advance. The verdict is invalidated if price falls below 70.03, where the SMA20 and Bollinger middle band sit.
- Ideal Entry Range: 70.03 to 70.03, where the chart’s first support and trend guide align.
- Exit Target: 75.79, the upper Bollinger band and next visible resistance.
- Stop Loss protection: 64.27, the lower Bollinger band and the nearest deeper support reference.
For non-traders, this means DBS is still moving up, but it is already running hot, so the chart is asking for patience rather than urgency.
“The market is still paying up, but it’s doing so with the kind of stretched momentum that can turn quickly if the next bid doesn’t show up.”
Summary Data DBS
| Last price | 73.94 SGD |
| Change 1 day / 5 days / 1 month | 0.60% / 2.75% / 13.01% |
| Trend / MA-cross | uptrend / none |
| SMA20 / SMA50 | 70.03 / 66.12 |
| RSI (14) / Stochastic %K | 79.9 / 100.0 |
| Bollinger %B / ATR | 84% / 1.28 |
| Support / Resistance 20 days | 65.40 / 73.94 |
| Data as of | 24 Juli 2026 08:00 WIB |


