RSI Overbought, OCBC Stock Gains 0.66% Today
On Juli 27, 2026: price 29.09 SGD, trend uptrend, RSI 79.6, support 24.66, resistance 29.18. technical analysis of ocbc stock. RSI Overbought — full details…

OCBC Bank’s shares on SGX rose to SGD 29.09 as of 24 July 2026, edging closer to the SGD 29.18 resistance marked in the 20-day range and matching the 3-month high, according to market data via Yahoo Finance. The move keeps the stock firmly in an uptrend, but the speed of the advance has pushed momentum indicators into overheated territory. That combination matters: it tells investors the rally is still intact, yet the market may be running faster than its short-term fundamentals of price action can comfortably sustain.
Trend & Price Action
The chart shows a clear upward structure. OCBC is trading above both the SMA20 at SGD 27.18 and the SMA50 at SGD 25.22, which means the share price is not just above its short-term average but also well above the medium-term trend line. That alignment is usually a sign that buyers have been in control for more than a few sessions.
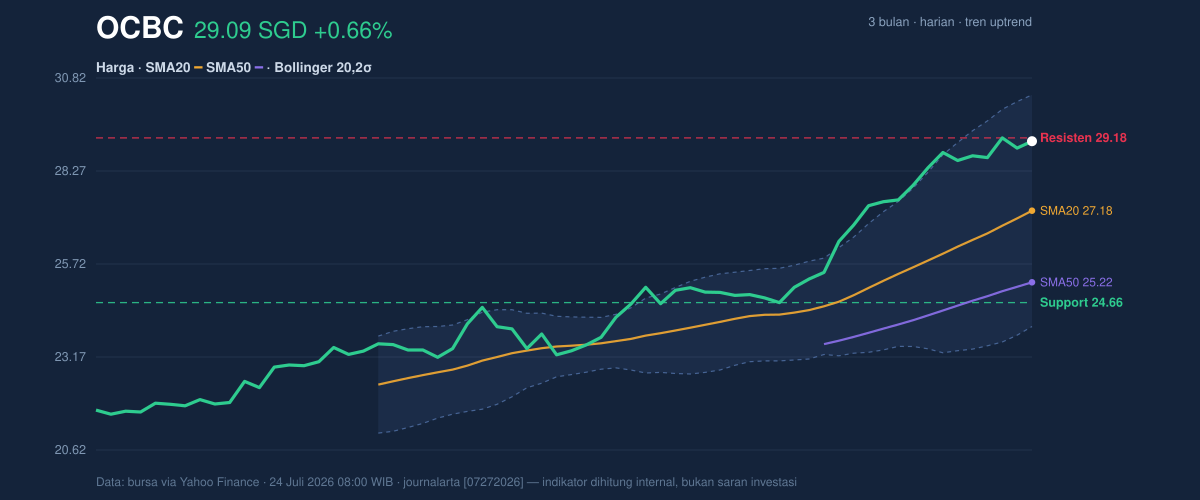
The slope of the SMA20, up 3.76% over 5 days, reinforces that message. A rising moving average is more useful than a flat one because it shows the trend is not merely holding; it is still being extended. At the same time, the stock is sitting at 98% of its 20-day range, which is a technical way of saying it is near the top of the recent trading band. When a stock is that close to the ceiling, the market often needs either a fresh wave of buying or a pause to digest gains.
The immediate barrier is SGD 29.18, while the nearest support sits at SGD 24.66. That gap is wide, and it signals there is room for the share price to swing if the trend loses steam. The Bollinger band top at SGD 30.36 is the next visible reference above current price, and the fact that the bands are widening suggests the market is preparing for larger moves, not smaller ones.
Oscillators & Momentum
Momentum is strong, but it is also stretched. The RSI at 79.6 and Stochastic %K at 97.6 / %D at 96.8 are both in overbought territory, which means the recent rise has been fast enough to leave the stock vulnerable to short-term cooling. Overbought does not automatically mean a reversal; it means the stock has already done a lot of work in a short time, so further gains may be harder to maintain without a breather.
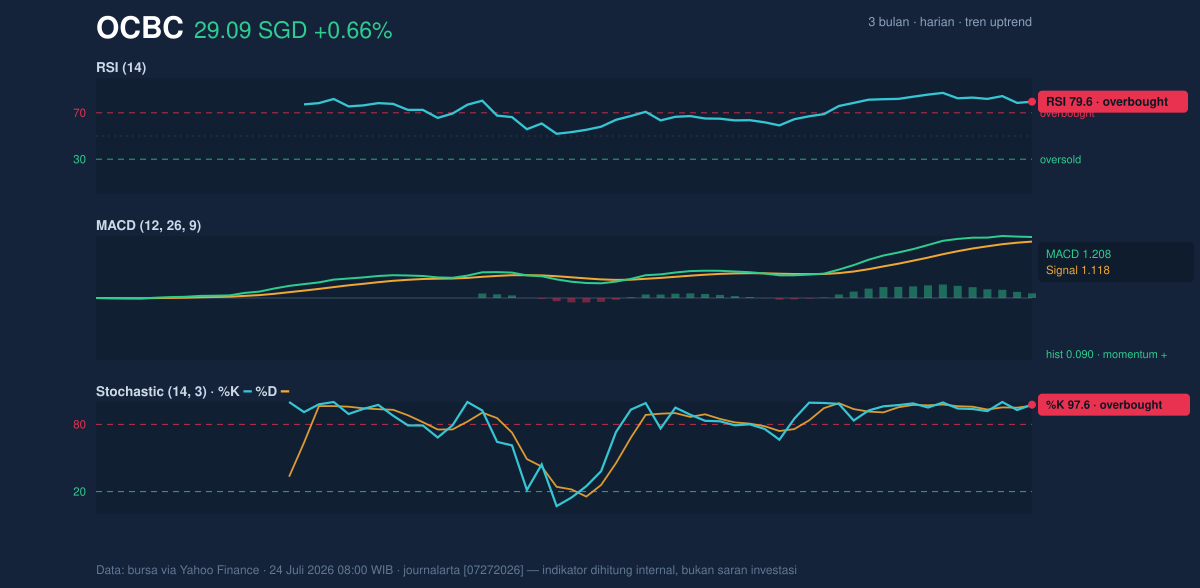
That said, the MACD at 1.208 remains above its signal line at 1.118, with a positive histogram of 0.090. In plain English, trend momentum is still pointing upward even though the oscillators are flashing caution. This is the kind of setup that often appears late in an advance: the trend is still healthy, but the pace is becoming less comfortable for new entries.
Volatility & Volume
Volatility is not muted. The Bollinger band width of 23.4% shows the range has expanded, which usually happens when a stock is moving decisively or when traders are repricing expectations more aggressively. The upper band at SGD 30.36 gives the current rally a visible ceiling, while the middle band at SGD 27.18 now acts as a short-term trend reference. If price starts slipping back toward that middle band, it would suggest the latest push is losing energy rather than reversing outright.
The ATR(14) at 0.62, or 2.1% of price, points to moderate day-to-day movement. That is important because it shows the stock can move in meaningful increments without being disorderly. Volume, however, is less convincing than price. The latest turnover of 4,831,300 was only 0.8× the 20-day average of 6,210,023. That means the latest advance did not come with unusually heavy participation, so the move is being confirmed more by price structure than by a surge in trading activity. The fact that OBV is rising still helps, because on-balance volume suggests money flow has been improving even if the latest session was not especially busy.
Key Levels & Scenarios
The most important near-term test is the SGD 29.18 resistance. A sustained move above that level would leave the stock in price discovery above its 20-day range, with the SGD 30.36 Bollinger upper band becoming the next technical reference. If the share price fails there, the chart suggests a pullback toward the SGD 27.18 SMA20, which is the first place where buyers may try to reassert control.
The broader trend remains constructive as long as price stays above the SGD 25.22 SMA50. A drop below that would not just be a normal pause; it would start to weaken the medium-term structure that has supported the rally. The 3-month low at SGD 21.51 remains far below current levels, showing the stock has already reclaimed a large part of its prior range.
Technical Verdict: HOLD (wait & see)
HOLD (wait & see)
- RSI 79.6 and Stochastic 97.6/96.8 indicate the stock is overbought, so upside may be harder to extend cleanly from here.
- MACD 1.208 above signal 1.118 still confirms positive trend momentum, which argues against calling the move weak.
- Price at SGD 29.09 is already close to SGD 29.18 resistance and the SGD 30.36 Bollinger upper band, so the chart needs either a breakout or a pullback to offer cleaner evidence.
Verdict invalidated if price breaks below SGD 27.18, the Bollinger middle band and SMA20 reference, because that would show the short-term trend is fading.
- Ideal entry range: SGD 27.18 to SGD 29.18
- Exit target: SGD 30.36
- Stop loss protection: below SGD 24.66
In plain English, the stock is still rising, but it is already stretched enough that the chart is asking for confirmation before the next move.
Summary Data OCBC
| Last price | 29.09 SGD |
| Change 1 day / 5 days / 1 month | 0.66% / 1.86% / 17.02% |
| Trend / MA-cross | uptrend / none |
| SMA20 / SMA50 | 27.18 / 25.22 |
| RSI (14) / Stochastic %K | 79.6 / 97.6 |
| Bollinger %B / ATR | 80% / 0.62 |
| Support / Resistance 20 days | 24.66 / 29.18 |
| Data as of | 24 Juli 2026 08:00 WIB |


