Shell Stock Drops 1.15% Today, Testing Key Resistance
On Juli 27, 2026: price 3,305.50 GBp, trend sideways, RSI 66.3, support 2,872.50, resistance 3,344.00. technical analysis of shell stock.

Shell plc traded in London on Thursday with the shares slipping to 3,305.50 GBp, down 1.15% on the day, even as the stock remains firmly above its short- and medium-term moving averages, according to data from Yahoo Finance via the London market at 24 July 2026 14:00 WIB. The move matters because it shows a stock that is still technically constructive, but now pressing into the upper part of its recent range, where momentum often starts to matter more than the trend itself.
Trend & Price Action
Shell’s chart still leans toward a positive structure, but not a runaway one. The shares are above the SMA20 at 3,088.80 and the SMA50 at 3,120.69, which tells traders the market is trading above both its near-term and intermediate averages. That is usually a sign that buyers have kept control of the broader tape, even if the latest session was softer. The trend label is still sideways, and that detail is important: a sideways trend with price above the averages often means the stock is consolidating gains rather than entering a fresh directional breakout.
The slope of the SMA20, at 2.71% over 5 days, suggests the short-term bias is still tilting higher. There has been no new MA-cross, so there is no fresh moving-average signal to imply a major regime shift. In plain English, the chart has not turned bearish; it has simply reached a point where the easy part of the move may already be behind it.
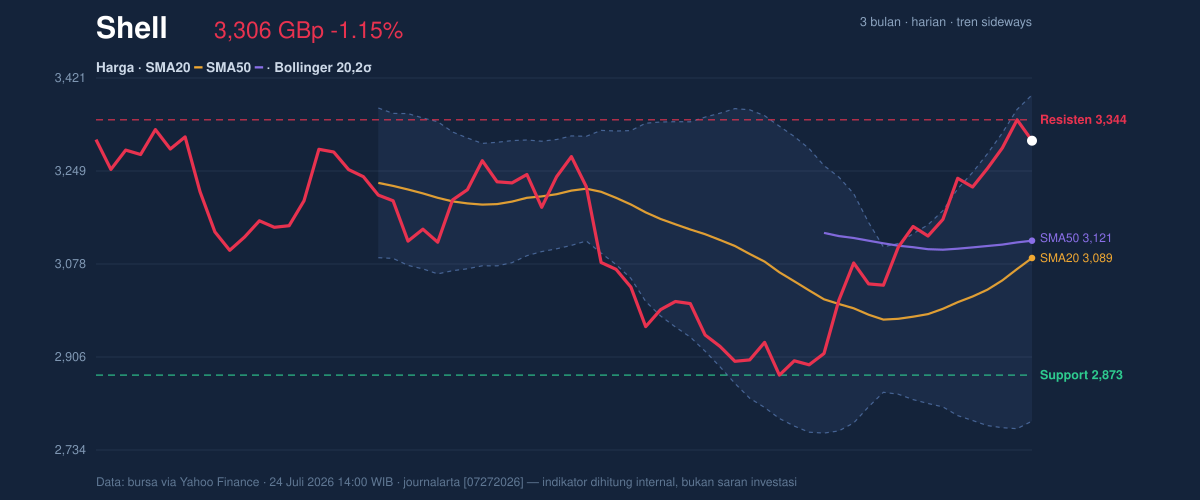
The share price is also sitting at 92% of the 20-hour range, with 20-hour support at 2,872.50 and 20-hour resistance at 3,344.00. That positioning is a sign of strength, but it also means the stock is near the top of the recent band, where follow-through becomes harder unless buyers bring fresh volume.
Oscillators & Momentum
Momentum is where the picture becomes more mixed. The RSI at 66.3 is still described as neutral, which means the stock is not yet in a classic overbought warning zone on that measure. But the Stochastic %K at 93.3 and %D at 95.8 are both overbought, and that is a more immediate caution flag. Stochastic tends to react faster than RSI, so when it is pinned near the top while price is already near resistance, it often signals that upside may be getting stretched in the short run.
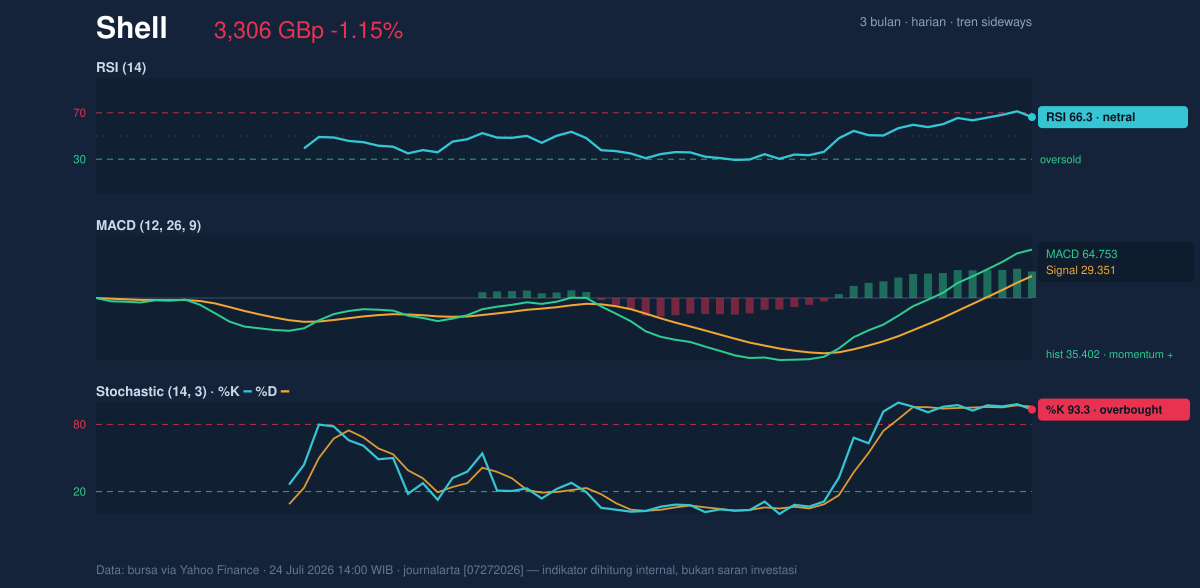
The MACD at 64.753, above its signal line at 29.351, with a histogram of 35.402, still points to positive momentum. In practical terms, MACD is saying the trend has not rolled over yet; the recent move still has underlying force. The tension between strong MACD and overbought Stochastic is the key signal here. That combination usually means the trend is intact, but the next move may be choppier, especially if price cannot clear resistance with conviction.
Volatility & Volume
Shell is not trading in a calm market. The ATR(14) at 132.79, equal to 4.0% of price, indicates high daily volatility. ATR, or average true range, is a measure of how much the stock typically moves; a higher reading means wider swings are normal, and stop levels need to respect that. The Bollinger Bands are also useful here: the upper band sits at 3,389.99, the middle band at 3,088.80, and the lower band at 2,787.61. With %B at 86% and a 19.5% band width, Shell is trading close to the upper band, but the band width remains normal rather than compressed. That means this is not a squeeze waiting to explode; it is a mature move already in motion.
Volume adds a subtle warning. Last volume was 7,460,298, below the 20-hour average of 8,718,722, or about 0.9x normal. So even though the price remains elevated, the market is not showing especially aggressive participation on the latest session. By contrast, OBV is rising, which means the broader volume trend still supports accumulation. The takeaway is that buyers have been present over time, but the latest push higher is not yet backed by a surge in trading activity.
Key Levels & Scenarios
The first level to watch is 3,344.00, which is both the recent 20-hour resistance and the previous close. A clean move above that area would tell the market is still willing to absorb supply near the top of the range. Above that, the next technical reference is the Bollinger upper band at 3,389.99, which would act as the next ceiling if momentum resumes.
On the downside, 3,088.80 is important because it is the SMA20 and the Bollinger middle band. Losing that zone would suggest the recent advance is fading and the stock is drifting back toward its balance point. Below that, 2,872.50 is the more meaningful range support. If that floor gives way, the chart would begin to look materially weaker, especially given the current overbought Stochastic reading.
The wider context still matters. Shell is trading well above its 3-month low of 2,559.50, but below its 3-month high of 3,758.50. That places the stock in the upper half of its three-month range, which is constructive, though not yet at a breakout extreme.
Technical Verdict: HOLD (wait & see)
HOLD (wait & see)
- MACD remains positive, so the broader trend has not broken.
- Stochastic is overbought, which warns that near-term upside may be stretched.
- Price is near resistance at 3,344.00 and close to the Bollinger upper band at 3,389.99, while volume is only 0.9x normal.
Verdict invalidated if price breaks below 2,872.50.
- Ideal Entry Range: 3,088.80 to 3,120.69
- Exit Target: 3,344.00 to 3,389.99
- Stop Loss protection: below 2,872.50
For non-traders: Shell still looks technically healthy, but the stock is close to resistance and momentum is stretched, so the chart is saying “wait for confirmation” rather than “chase the move.”
Summary Data Shell
| Last price | 3,305.50 GBp |
| Change 1 day / 5 days / 1 month | -1.15% / 2.15% / 14.06% |
| Trend / MA-cross | sideways / none |
| SMA20 / SMA50 | 3,088.80 / 3,120.69 |
| RSI (14) / Stochastic %K | 66.3 / 93.3 |
| Bollinger %B / ATR | 86% / 132.79 |
| Support / Resistance 20 days | 2,872.50 / 3,344.00 |
| Data as of | 24 Juli 2026 14:00 WIB |


