Tencent Stock Analysis: Drops 2.38%, Golden Cross Formed
On Juli 27, 2026: price 434.60 HKD, trend sideways, RSI 43.3, support 411.80, resistance 484.00. technical analysis of tencent stock. Tencent Stock Analysis —…

Tencent Holdings slipped on the Hong Kong exchange, with 0700.HK last at 434.60 HKD, down from 445.20 at the previous close, as the shares stayed below both short- and medium-term moving averages and near the lower half of their recent trading range. The move matters less as a single-day drop than as a signal: the stock is still trying to stabilize after a weak five-day stretch, but the chart is not yet showing convincing follow-through from buyers. It is a market that is soft, not broken.
Trend & Price Action
Tencent’s broader setup is best described as sideways, but with a slight tilt weaker in the near term. The price is below the SMA20 at 452.53 and the SMA50 at 449.46, which tells traders the shares are trading under both the short-term and intermediate trend gauges. That usually means rallies are meeting supply before they can fully reassert control. At the same time, the chart still shows a golden cross, where the SMA20 has moved above the SMA50. In plain English, that is a bullish structural signal — but one that can lose influence quickly if price keeps sitting underneath both averages.
The position inside the range is also important. Tencent is trading at 32% of the 20-hour range, closer to the lower end than the middle, and the 20-hour support at 411.80 sits just above the 3-month low of 411.00. That is a narrow cushion. If the floor gives way, the market would be telling investors that the recent rebound attempt has failed to hold. The nearby overhead marker is 484.00 resistance, which aligns with the upper side of the current range and the zone where momentum would need to improve materially.
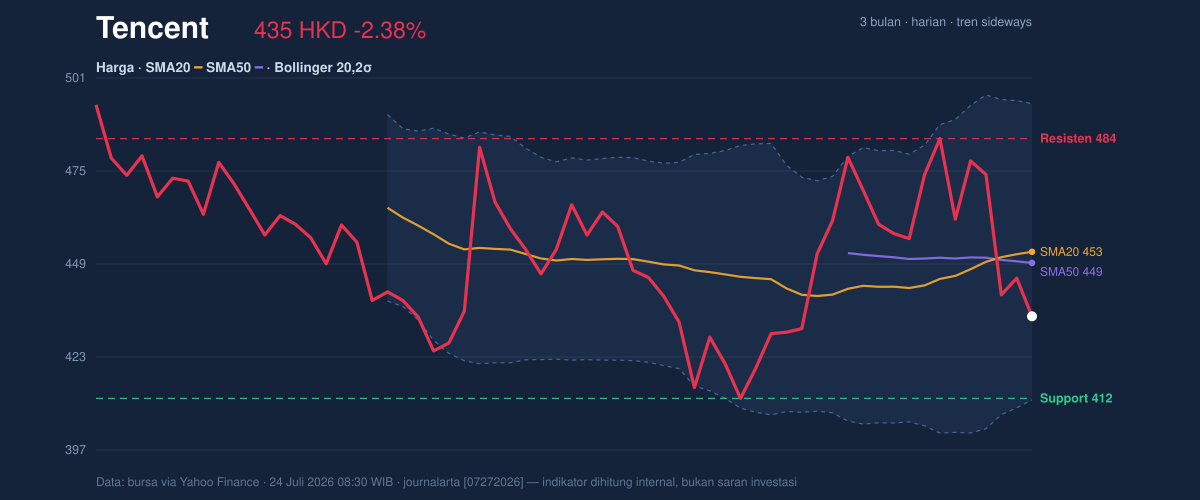
A short version: the trend is not bullish enough to ignore, but not weak enough to call a clean breakdown yet.
Oscillators & Momentum
The momentum indicators are mixed, and that mix is the real story. The RSI at 43.3 is neutral, which means Tencent is neither stretched nor washed out on that measure. Neutral RSI often signals indecision: the market has room to move either way, but it needs a catalyst. More revealing is the Stochastic reading of 4.1 versus 18.2, which is deeply oversold. Stochastic measures where price sits relative to its recent range, so this reading says the stock has been pressed toward the lower end of its short-term band and may be vulnerable to a bounce if selling pressure eases.
But momentum is not yet turning up. The MACD at 1.177 remains below the signal line at 3.527, with the histogram at -2.349. That combination means downside momentum still exceeds upside momentum, even if price is oversold on Stochastic. In practical terms, oversold does not automatically mean reversal; it often means a stock is simply getting cheaper faster than momentum can recover. The chart shows that tension clearly.
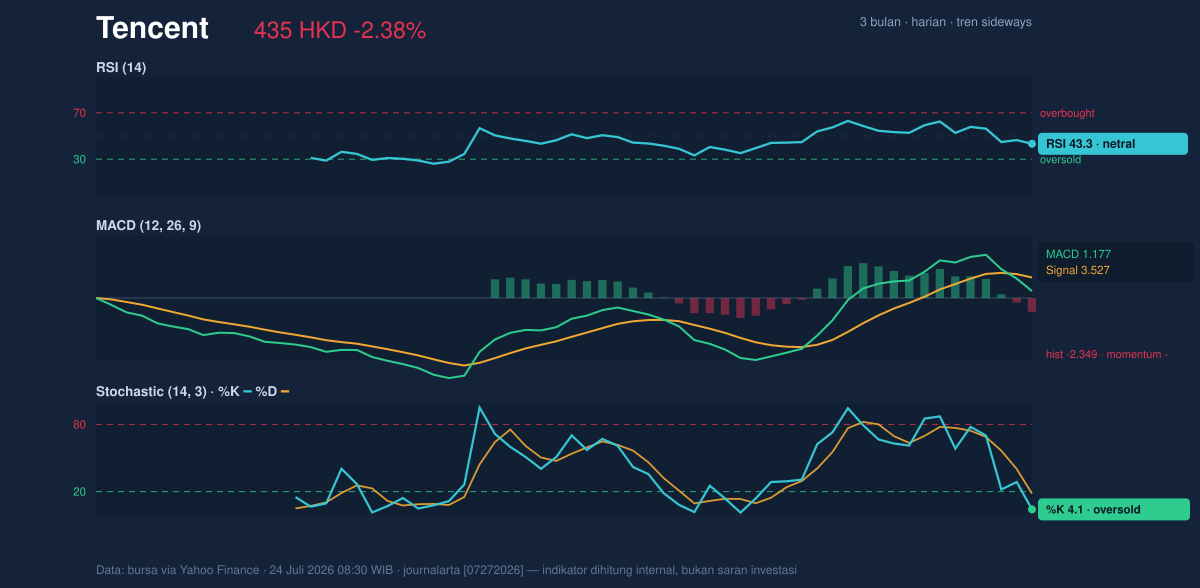
So the signal set is split: one oscillator says “stretched,” another says “still weak.”
Volatility & Volume
Volatility is elevated enough to matter. The ATR(14) at 19.50, or 4.5% of price, indicates that Tencent can move quickly in either direction from here. ATR is a measure of typical daily range, so a higher reading means tighter stop levels can be vulnerable to normal noise. The Bollinger setup adds context: the lower band is 411.35, the middle band is 452.53, and the upper band is 493.71. With %B at 28% and band width at 18.2%, price is sitting in the lower portion of the envelope, but the bands are not unusually compressed. That suggests the stock is not coiling for a dramatic squeeze; instead, it is already moving inside a fairly ordinary volatility regime.
Volume is not confirming a decisive turn. The latest print of 22,959,603 shares is only 0.6x normal versus the 20-hour average of 36,647,668, and OBV is falling. OBV, or on-balance volume, tracks whether trading activity is accumulating on up days or down days. A declining OBV alongside a price that is below key averages usually means sellers have had the stronger hand, even if the price has not yet broken support.
That is the caution flag.
Key Levels & Scenarios
The market’s immediate map is straightforward. The first line to watch is 411.80 support, essentially the same area as the 411.35 Bollinger lower band and the 411.00 3-month low. If Tencent holds above that zone, the oversold Stochastic reading could support a rebound attempt. If it fails, the chart would likely shift from range-bound weakness to a more fragile structure.
On the upside, 449.46 and 452.53 are the first technical hurdles because they are the SMA50 and SMA20. A move back above both would be a sign that the stock is repairing its short-term posture. Beyond that, 484.00 resistance and the 493.71 upper Bollinger band define the area where the market would need stronger participation to prove a more durable recovery.
Technical Verdict: HOLD (wait & see)
HOLD (wait & see)
- The price is below both SMA20 and SMA50, so the near-term trend remains under pressure even though the chart still carries a golden cross.
- The Stochastic is oversold, but the MACD is still negative, which means the stock is stretched without yet showing a confirmed momentum turn.
- Volume is below average and OBV is falling, so the latest decline is not being offset by clear accumulation.
Verdict invalidated if price breaks below 411.80.
- Ideal Entry Range: 411.80 to 434.60 HKD
- Exit Target (Target Price): 449.46 to 452.53 HKD
- Stop Loss protection: below 411.00 HKD
In plain English: Tencent is cheap enough to watch closely, but not yet strong enough to say the sellers have lost control.
“If 411.80 gives way, the chart is telling us the floor is no longer a floor.”
Summary Data Tencent
| Last price | 434.60 HKD |
| Change 1 day / 5 days / 1 month | -2.38% / -5.85% / 3.13% |
| Trend / MA-cross | sideways / golden |
| SMA20 / SMA50 | 452.53 / 449.46 |
| RSI (14) / Stochastic %K | 43.3 / 4.1 |
| Bollinger %B / ATR | 28% / 19.50 |
| Support / Resistance 20 days | 411.80 / 484.00 |
| Data as of | 24 Juli 2026 08:30 WIB |


