UOB Stock Analysis: Gains 0.74%, Momentum Weakens
On Juli 27, 2026: price 43.32 SGD, trend uptrend, RSI 63.1, support 39.65, resistance 44.95. technical analysis of uob stock. UOB Stock Analysis — full details…

United Overseas Bank’s SGX-listed shares rose to 43.32 SGD as of 24 July 2026 at 08:00 WIB, extending a short-term uptrend while still trading below the near-term ceiling shown in the chart. The move sits comfortably above the stock’s SMA20 at 42.40 and far above the SMA50 at 40.02, which tells investors the market is still paying up for the name even after a recent run. Yet the picture is not uniformly bullish: momentum has cooled, and the latest price action looks more like consolidation inside a rising trend than a fresh breakout.
Trend & Price Action
As shown in the chart, UOB is still moving in an uptrend, with the SMA20 slope rising 1.90% over 5 days. That matters because a rising short-term average usually reflects persistent demand rather than a one-day spike. The share price is also above both the SMA20 and SMA50, which is the classic sign that the medium-term structure remains constructive.
The absence of a new MA-cross is important in a different way. It means the rally is not being driven by a fresh moving-average crossover signal; instead, the stock is simply holding an already-established trend. In plain language, the market has not produced a new technical acceleration signal, but neither has it lost its upward bias. The price is also sitting at roughly 69% of its 20-hour range, which shows it is closer to the upper half of the recent band without yet pressing into the resistance zone.
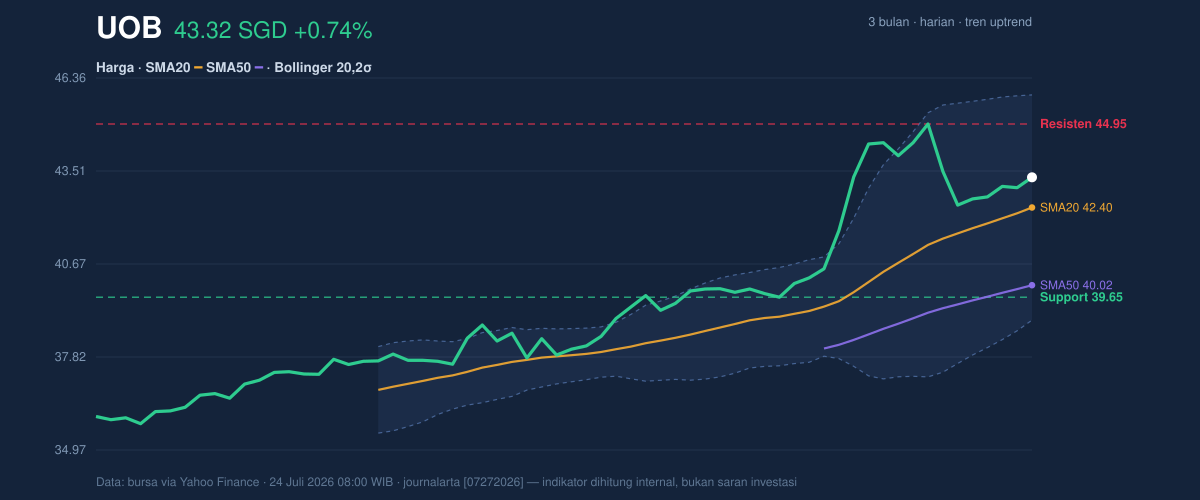
The nearest support at 39.65 and resistance at 44.95 frame the current battle. That spread is wide enough to allow movement, but not so wide that the stock looks directionless. With the 3-month high at 45.15, UOB is approaching an area where earlier sellers were willing to emerge, so the market will need more than a modest drift to clear that ceiling.
Oscillators & Momentum
The momentum gauges are mixed rather than decisive. The RSI at 63.1 is still neutral by the data set’s framing, but it is close enough to the upper end of the range to suggest the stock has become more extended than it was a month ago. That usually means upside is still possible, though the pace may be less explosive than before. The Stochastic %K at 59.2 and %D at 58.3 are also neutral, which implies neither overbought pressure nor oversold repair is dominating.
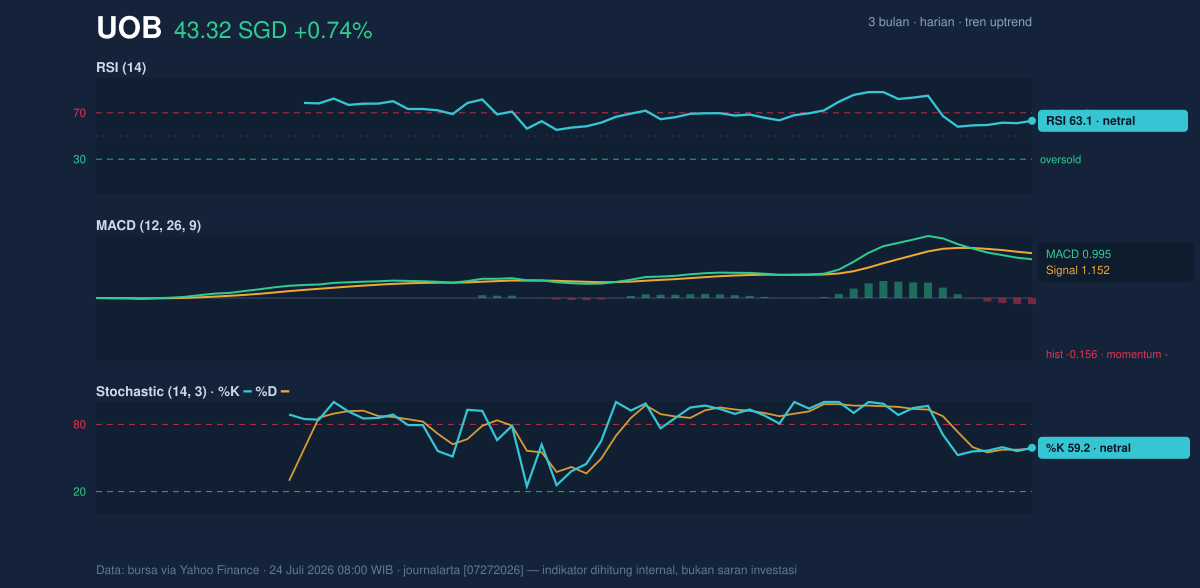
The more cautionary signal comes from MACD at 0.995 versus a signal line at 1.152, leaving a -0.156 histogram. In practical terms, that means the faster trend line has slipped below the slower one, so upside momentum is no longer leading price. This does not automatically reverse the trend, but it does warn that the rally may be losing torque. When RSI and Stochastic are neutral while MACD turns negative, the message is usually “pause,” not “panic.”
Volatility & Volume
Volatility is contained rather than stretched. The Bollinger band width at 16.3% is described as normal, and the %B at 63% places the stock above the midline but not near the upper band at 45.84. That combination suggests UOB is trending without being in a volatility squeeze or an overextended breakout condition. In other words, the shares have room to move, but the chart is not signaling an imminent explosive expansion.
The ATR at 1.05, equal to 2.4% of price, reinforces that reading. Average true range is a measure of how much a stock typically moves in a day; at this level, the market is active enough to matter, but not wild. Volume, however, is the softer spot in the setup. The latest trade volume of 1,831,401 was only about 0.5× the 20-hour average of 3,477,167, which means the latest rise came on relatively quiet participation. That matters because advances on weak volume often need follow-through to prove they are more than a drift higher.
Still, the OBV is rising, which is a constructive offset. On-balance volume tracks whether volume is accumulating on up days or down days, so a rising OBV suggests money has been quietly leaning into the stock even if the latest print was not especially busy. That creates a subtle divergence: the tape is not screaming, but underlying participation has not broken down either.
Key Levels & Scenarios
The key technical map is straightforward. 39.65 is the first important floor, because a loss of that level would weaken the current range structure and expose the lower part of the recent trading band. On the upside, 44.95 is the immediate barrier, with 45.15 marking the 3-month high just above it. A clean move through that zone would matter because it would show the stock is not just drifting near resistance, but actually clearing a prior supply area.
The Bollinger framework adds another reference point: the upper band at 45.84 is the technical stretch target inside the current volatility envelope. If price fails near 44.95, the chart would likely remain range-bound within the upper half of the band. If it breaks above that area, the next test would be whether momentum indicators improve as price approaches the upper band.
Technical Verdict: HOLD (wait & see)
HOLD (wait & see)
- Price is above SMA20 and SMA50, which supports the trend, but the MACD histogram at -0.156 shows momentum is not confirming the move.
- RSI at 63.1 and Stochastic at 59.2/58.3 are neutral, so the stock is not oversold enough for a fresh rebound signal and not overbought enough for a clear exhaustion signal.
- Volume is only 0.5× average, so the latest rise lacks strong participation even though OBV is rising.
- Verdict invalidated if price falls below 39.65.
- Ideal Entry Range: 42.40 to 43.32
- Exit Target: 44.95 to 45.15
- Stop Loss protection: below 39.65
In plain English, UOB still looks technically healthy, but the chart is asking for stronger confirmation before the next leg higher.
Summary Data UOB
| Last price | 43.32 SGD |
| Change 1 day / 5 days / 1 month | 0.74% / 2.00% / 8.84% |
| Trend / MA-cross | uptrend / none |
| SMA20 / SMA50 | 42.40 / 40.02 |
| RSI (14) / Stochastic %K | 63.1 / 59.2 |
| Bollinger %B / ATR | 63% / 1.05 |
| Support / Resistance 20 days | 39.65 / 44.95 |
| Data as of | 24 Juli 2026 08:00 WIB |


