DBS Stock Technicals Today: Gains 1.20%, RSI Overbought
On Juli 28, 2026: price 74.38 SGD, trend uptrend, RSI 79.9, support 65.40, resistance 73.94. technical analysis of dbs stock. DBS Stock Technicals — full…

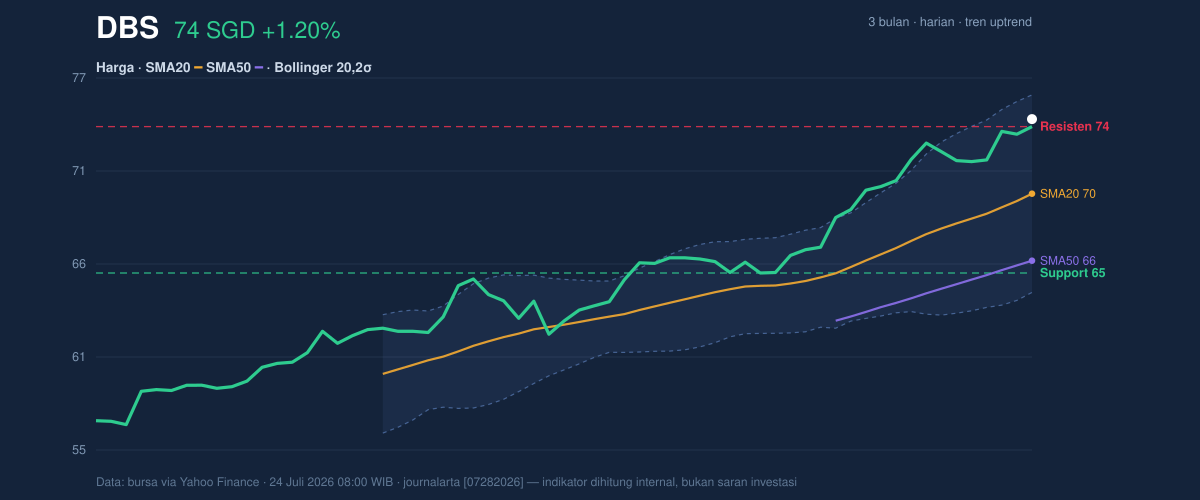
DBS Group’s shares were last quoted at 74.38 SGD, up 1.20% on the day and 13.68% over the past month, according to data from SGX-linked market feeds via Yahoo Finance. That move has pushed the stock just beyond its recent 20-hour resistance at 73.94 and to a fresh position near the top of its 3-month range, a sign that buyers are still in control — but also that the price is now stretched. As shown in the chart, the rally is not happening in a vacuum: the shares are trading above both the SMA20 at 70.03 and the SMA50 at 66.12, which tells readers that the short- and medium-term trend remains constructive.
Trend & Price Action
The most important signal in DBS right now is not just that the price is rising, but that it is doing so above key moving averages. When a stock sits above the SMA20 and SMA50, it usually means recent buying has been strong enough to keep pullbacks contained and to preserve the broader uptrend. The SMA20 is rising at 2.54% over 5 days, which matters because a steepening average often reflects persistent demand rather than a one-day burst. There is no fresh MA-cross, so this is not a new trend reversal signal; instead, it is an established uptrend that is continuing to extend.
The price is also trading at 105% of its 20-hour range, with the latest close above the 20-hour resistance at 73.94. That tells a simple story: the market has already tested the upper edge of the recent band and is now trying to convert resistance into support.
A short move higher can be healthy. A move this extended can also invite pauses.
Oscillators & Momentum
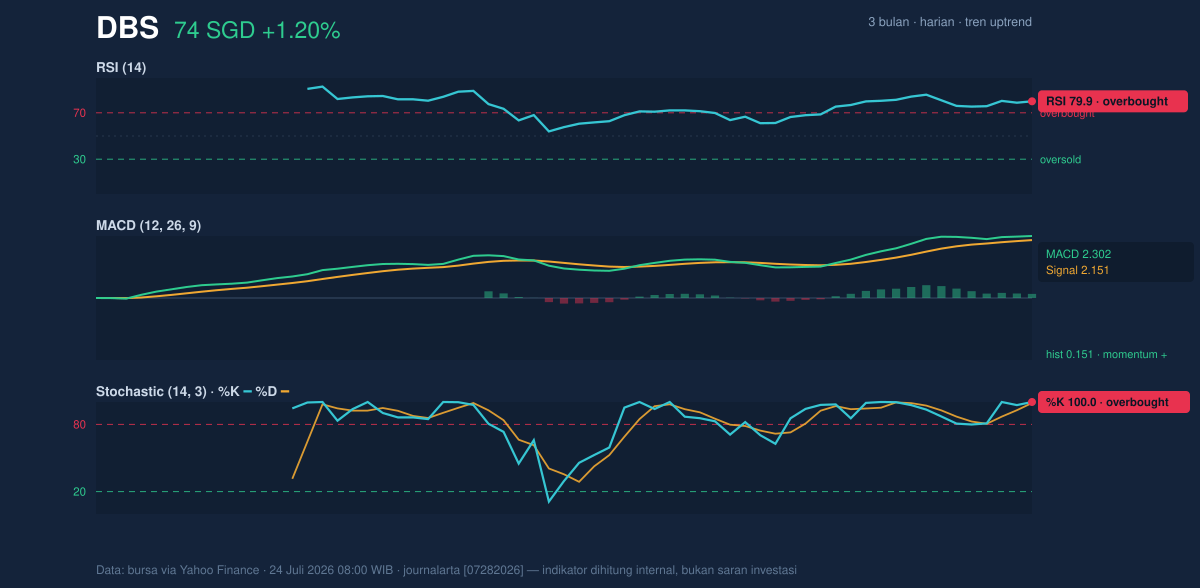
Momentum indicators are aligned with the price trend, but they are also waving a caution flag. The RSI at 79.9 is in overbought territory, which does not mean the stock must fall; it means the recent pace of gains has been fast enough that the market may be vulnerable to consolidation or a brief retracement. The Stochastic %K at 100.0 and %D at 99.1 reinforce that message: the stock is pressing against the upper boundary of its recent momentum range, leaving little room before it becomes technically “stretched.”
At the same time, the MACD at 2.302 remains above the signal line at 2.151, with a positive histogram of 0.151. That is important because MACD is a trend-following tool: when it stays positive, it implies the underlying trend still has forward motion even if shorter-term oscillators are overheated. In plain English, DBS is not showing a breakdown in momentum; it is showing momentum that may need to cool before the next leg.
Volatility & Volume
Volatility is present, but not excessive. The ATR(14) at 1.28, equal to 1.7% of price, suggests a market that can still move meaningfully in a session, but without the kind of wild swings associated with disorderly trading. The Bollinger Band width of 16.4% is described as normal, which means the stock is not in a squeeze that typically precedes a sharp breakout, nor is it in an expansion phase that would signal unusually high stress. The key detail is where price sits inside the bands: %B at 88% means DBS is trading close to the upper Bollinger band at 75.79. That usually signals strength, but it also means the easy part of the move may already have happened.
Volume adds a more nuanced read. Last volume was 2,772,500, below the 20-hour average of 4,157,503, or about 0.7× normal. In trend analysis, rising price on lighter volume can still be valid, but it often suggests the latest push is not yet being confirmed by broad participation. The fact that OBV is rising softens that concern: on-balance volume tracks whether money is generally flowing into the stock over time, and a rising OBV says accumulation has not disappeared even if the latest session was quieter.
Key Levels & Scenarios
The nearby map is straightforward. The first level to watch is the 73.94 resistance, which the stock has now exceeded. If DBS can keep closing above that area, the market may treat it as a new floor rather than a ceiling. Above that, the next technical reference is the upper Bollinger band at 75.79, which often acts as a short-term cap when momentum is stretched.
On the downside, the most relevant support is the SMA20 at 70.03, which also matches the Bollinger middle band. That makes it a natural line of defense for the current trend. Below that, the 20-hour support at 65.40 becomes the deeper protection zone. A fall back through the mid-band would suggest the recent breakout has lost traction; a break below the deeper support would imply the market is no longer respecting the current uptrend structure.
Technical Verdict: HOLD (wait & see)
HOLD (wait & see) is the clearest technical read because the trend is still positive, but momentum is overstretched.
- Reason 1: Price remains above the SMA20 at 70.03 and SMA50 at 66.12, which keeps the broader uptrend intact.
- Reason 2: MACD is positive, so trend momentum has not rolled over even after the recent run-up.
- Reason 3: RSI at 79.9 and Stochastic at 100.0/99.1 show the stock is overbought, making near-term follow-through less certain.
- Verdict invalidated if price falls below 70.03, because that would mean the stock has lost its key trend support.
- Ideal Entry Range: 70.03 to 73.94
- Exit Target: 75.79
- Stop Loss protection: 65.40
For non-traders, this means DBS is still strong, but the chart says the stock may need to catch its breath before it can climb further.
Summary Data DBS
| Last price | 74.38 SGD |
| Change 1 day / 5 days / 1 month | 1.20% / 3.36% / 13.68% |
| Trend / MA-cross | uptrend / none |
| SMA20 / SMA50 | 70.03 / 66.12 |
| RSI (14) / Stochastic %K | 79.9 / 100.0 |
| Bollinger %B / ATR | 88% / 1.28 |
| Support / Resistance 20 days | 65.40 / 73.94 |
| Data as of | 24 Juli 2026 08:00 WIB |


