HSBC Stock Gains 0.80% Today, RSI Overbought
On Juli 28, 2026: price 162.80 HKD, trend uptrend, RSI 74.0, support 147.60, resistance 161.50. technical analysis of hsbc stock. HSBC Stock Gains — full…

At HK$162.80, HSBC Holdings is trading just above its 3-month high of HK$162.00, extending a one-month gain of 9.78% and keeping the stock firmly in an uptrend. The move is notable not just for the price itself, but for where it sits on the chart: the shares are now above the SMA20 at HK$153.96 and SMA50 at HK$147.94, which means the shorter trend remains comfortably ahead of the longer one. That alignment usually signals that buyers have been in control for long enough to lift the trend, even if the pace of the advance is now starting to look stretched.
Trend & Price Action
As shown in the chart, HSBC is trading in the upper edge of its recent range, at 109% of the 20-hour range, with the price also above the Bollinger upper band at HK$162.09. That matters because a move beyond the upper band often reflects momentum strong enough to push price outside its recent statistical envelope. It can also mean the stock is running hot: the market may be paying up faster than the average pace of the last 20 sessions can justify. The SMA20 slope of 1.78% over 5 days confirms that the trend is still rising, but the absence of a fresh MA-cross suggests this is continuation rather than a new technical breakout regime.
The key message from price structure is simple: the trend is intact, but the stock is no longer cheap on a short-term basis.
Oscillators & Momentum
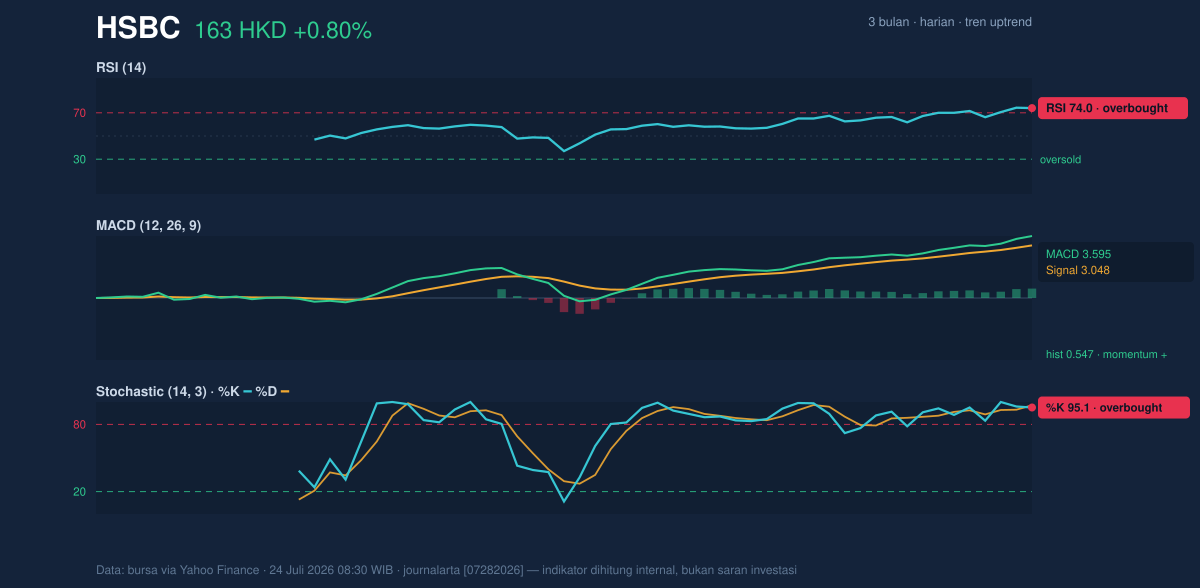
The momentum tools are aligned, but they are also flashing caution. The RSI at 74.0 is in overbought territory, which means the recent advance has been strong enough that it may be vulnerable to cooling off if fresh buying slows. The Stochastic %K at 95.1 and %D at 97.0 are also overbought, reinforcing the message that the stock is near the top of its near-term momentum cycle. In plain language, these readings do not mean an immediate reversal is guaranteed; they mean the stock has already done a lot of the work in a short period, so the margin for disappointment is thinner.
That said, the MACD at 3.595 remains above its signal line at 3.048, with a positive histogram of 0.547. This is important because MACD measures whether momentum is still expanding, and here it is. So while RSI and Stochastic warn that the rally is extended, MACD says the trend has not yet clearly rolled over. The chart is therefore showing a familiar tension: overbought does not automatically mean broken, especially when the broader direction is still up.
Volatility & Volume
Volatility is not exploding. HSBC’s ATR(14) of 2.66, equal to 1.6% of price, points to moderate volatility rather than a disorderly move. That suggests the stock can still travel meaningfully in either direction, but without the kind of whipsaw conditions that usually accompany panic or event risk. The Bollinger band width of 10.6% is described as normal, which also argues against a volatility squeeze that might be about to release into a sharp breakout. Instead, the setup looks like a steady trend that has reached the upper end of its recent statistical range.
Volume adds a more nuanced read. Last turnover was 10,606,273, below the 20-session average of 13,921,820, or about 0.8x normal. That matters because a rally on lighter volume can suggest the move is not being backed by broad participation. On the other hand, OBV is rising, which means cumulative volume flow still favors the upside. Put together, the message is that demand has not disappeared, but the latest push higher is not being confirmed by strong trading activity. The rally is still alive; it is just not being chased aggressively.
Key Levels & Scenarios
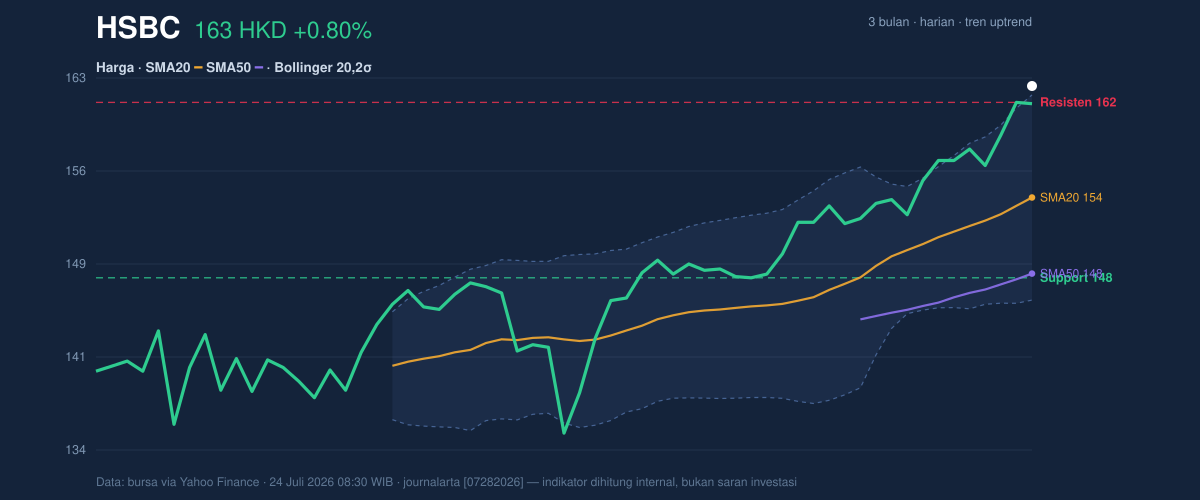
The nearest reference points are clear. Resistance at HK$161.50 has already been exceeded, and the stock is now trading above the 3-month high of HK$162.00. That means the market is in price discovery above its recent ceiling. The most important nearby floor is support at HK$147.60, which also sits close to the SMA20 at HK$153.96 and well above the SMA50 at HK$147.94. If the stock can hold above the former resistance zone, the chart suggests the breakout has room to persist. If it slips back below the support band, the message changes quickly: the move would start to look like an overextended advance failing to hold its gains.
The core signal is that HSBC remains in a healthy uptrend, but the rally is now technically stretched and vulnerable to a pause or pullback if momentum fades.
Technical Verdict: HOLD (wait & see)
- RSI at 74.0 and Stochastic at 95.1/97.0 are both overbought, which warns that upside may be getting crowded in the short term.
- MACD remains positive with the histogram above zero, and price is above SMA20 and SMA50, so the broader trend is still constructive.
- Price above the Bollinger upper band and just beyond the 3-month high of HK$162.00 shows strength, but also elevates the risk of near-term mean reversion.
Verdict invalidated if price falls below HK$147.60, the stated support level.
- Ideal Entry Range: HK$153.96 to HK$147.60, near the SMA20 and support zone.
- Exit Target: HK$162.09 to HK$162.80, using the Bollinger upper band and current price area as the nearest technical ceiling.
- Stop Loss protection: below HK$147.60, where the support structure would fail.
For non-traders, this means the stock still looks strong, but it is no longer at an easy entry point because the short-term momentum is already stretched.
HSBC’s last close was HK$161.50.
Summary Data HSBC
| Last price | 162.80 HKD |
| Change 1 day / 5 days / 1 month | 0.80% / 3.76% / 9.78% |
| Trend / MA-cross | uptrend / none |
| SMA20 / SMA50 | 153.96 / 147.94 |
| RSI (14) / Stochastic %K | 74.0 / 95.1 |
| Bollinger %B / ATR | 104% / 2.66 |
| Support / Resistance 20 days | 147.60 / 161.50 |
| Data as of | 24 Juli 2026 08:30 WIB |


