Momentum Gains, Alibaba Stock Drops 3.39% Today
On Juli 28, 2026: price 111.00 HKD, trend sideways, RSI 49.7, support 89.50, resistance 117.00. technical analysis of alibaba stock. Momentum Gains — full…

Alibaba Group’s Hong Kong-listed shares fell to 111.00 HKD on HKEX on 24 July 2026, down 3.39% from the previous close, as the stock gave back part of a strong 16.84% gain over the past month and settled back below its nearer-term ceiling, as shown in the chart. The move leaves the name in a technically mixed position: still above its short-term average, but no longer pressing the top of its recent range.
Trend & Price Action
The main signal here is not a clean breakout or breakdown, but a market trying to decide whether the recent rally has enough follow-through. Alibaba is trading above its SMA20 at 105.90, which keeps the short-term trend constructive, yet it remains below its SMA50 at 113.66, a reminder that the medium-term structure has not fully turned in its favor. That gap matters because the 50-day average often acts like a line of memory for institutional traders: when price sits below it, rallies can still happen, but they tend to face selling from holders who want to get back to even.
The broader trend is labeled sideways, and the SMA20 slope of 3.48% over 5 days suggests the recent bounce is still alive, just not powerful enough to shift the stock into a decisive uptrend. Price is also sitting at 78% of the 20-hour range, which means it has already recovered a large portion of the available intraday space and is closer to resistance than support. In practical terms, the stock is not deeply weak — but it is no longer cheap relative to its own immediate trading band.
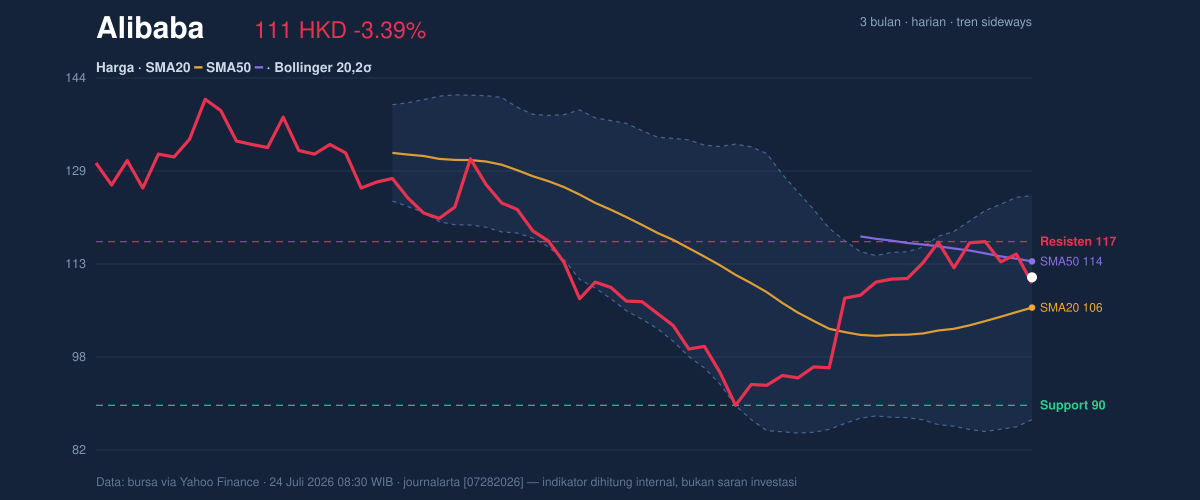
The chart shows a market that has room, but not much margin for error.
Oscillators & Momentum
Momentum indicators are telling a story of balance rather than excess. The RSI(14) at 49.7 is almost perfectly neutral, which means the stock is neither stretched upward nor washed out. That matters because a neutral RSI after a strong monthly rise often signals consolidation rather than immediate continuation; the market is pausing to test whether buyers remain committed. The Stochastic %K at 57.2 and %D at 69.9 is also neutral, but with %K below %D, short-term momentum has cooled a little from the earlier push. In plain terms, the stock still has positive undertones, but the faster oscillator is no longer leading the way.
The more important confirmation comes from MACD. With MACD at 1.340 versus a signal line at -0.002 and a histogram at 1.342, the momentum framework remains positive. MACD above its signal line typically indicates that the recent trend is still stronger than the longer baseline, and the positive histogram shows that this advantage is still intact. However, because RSI is neutral rather than strong, the chart is not flashing a powerful overbought extension; instead, it suggests a trend that is positive but vulnerable to hesitation if price fails to reclaim higher ground.
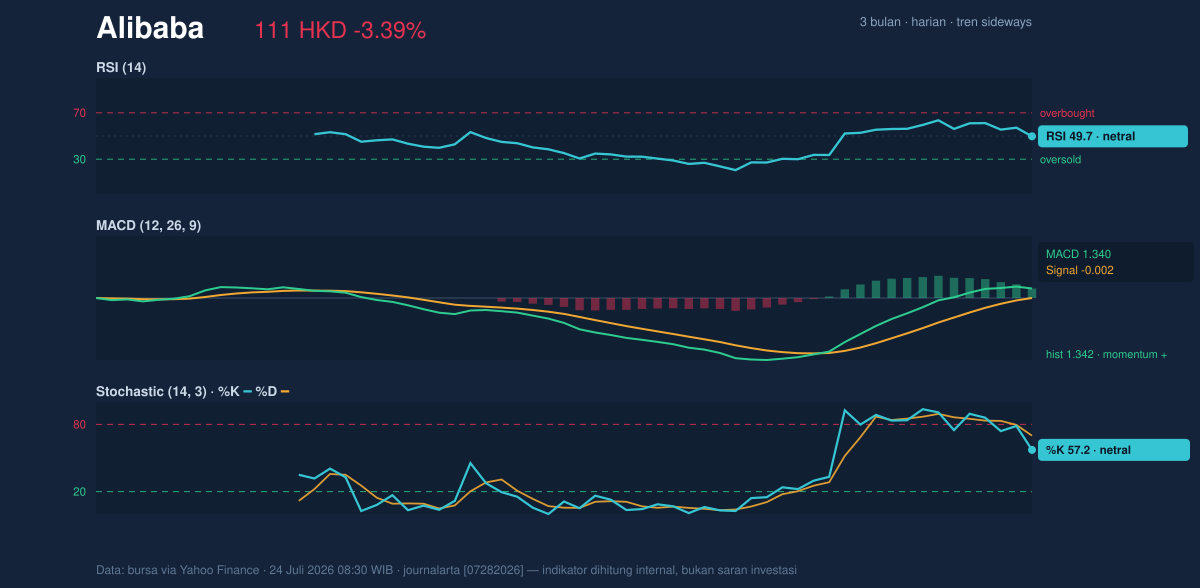
Momentum is supportive, but not yet decisive.
Volatility & Volume
Volatility has clearly expanded. The Bollinger Band structure shows the upper band at 124.72, the middle band at 105.90, and the lower band at 87.09, with %B at 64% and the band width at 35.5%. A widening band usually means the stock has moved out of a quiet phase and is now capable of larger swings. That is reinforced by the ATR(14) of 6.15, equal to 5.5% of price, which is a high-volatility reading for a large-cap name. This combination matters because it raises the odds that any break of support or resistance could travel quickly.
Volume, however, is not confirming a full-force breakout attempt. Last volume was 107,488,512, below the 20-day average of 120,924,208, or about 0.9× normal. That means the latest decline happened without unusually heavy participation, which reduces the urgency of the selloff. At the same time, OBV is rising, and that is an important counterweight: on-balance volume tracks whether money flow is generally accumulating or distributing over time. Rising OBV while price consolidates often suggests buyers have not disappeared, even if they are not yet forcing a breakout.
Key Levels & Scenarios
The nearest technical map is clear. Support sits at 89.50, while resistance is 117.00. Those levels frame the stock’s current battle. Since price is already near the upper half of the recent range, a push toward resistance would need follow-through to matter. If Alibaba can reclaim and hold above 117.00, the chart would start to look like a continuation attempt rather than a mere rebound. If it fails there, the move likely remains trapped inside the current sideways structure.
The Bollinger framework adds another layer: 105.90 is the middle band and also the SMA20, so losing that area would weaken the short-term base and expose the lower band at 87.09. Meanwhile, the 3-month high of 144.00 and 3-month low of 88.65 show that the stock has already moved well off the bottom of its range, but has not yet returned to the upper end of its broader trading zone. The current price is closer to the lower half of that 3-month span than to the peak, which keeps the recovery incomplete.
Technical Verdict: HOLD (wait & see)
HOLD (wait & see) fits best because the chart shows mixed signals: price remains above the SMA20, MACD is positive, and OBV is rising, but price is still below the SMA50, RSI is neutral, and the latest move came on below-average volume. The widening Bollinger Bands and high ATR mean the next move could be fast, but direction is not yet fully confirmed. The verdict is invalidated if price breaks below 89.50, because that would damage the current support base and likely shift the chart from consolidation into deeper weakness.
- Ideal Entry Range: 105.90 to 111.00 HKD
- Exit Target: 117.00 HKD
- Stop Loss protection: below 89.50 HKD
For non-traders, this means Alibaba’s chart is still constructive, but it needs a cleaner move to prove the rebound is more than a pause.
The 3-month high is 144.00 HKD.
Summary Data Alibaba
| Last price | 111.00 HKD |
| Change 1 day / 5 days / 1 month | -3.39% / -1.42% / 16.84% |
| Trend / MA-cross | sideways / none |
| SMA20 / SMA50 | 105.90 / 113.66 |
| RSI (14) / Stochastic %K | 49.7 / 57.2 |
| Bollinger %B / ATR | 64% / 6.15 |
| Support / Resistance 20 days | 89.50 / 117.00 |
| Data as of | 24 Juli 2026 08:30 WIB |


