OCBC Stock Technicals Today: Gains 1.35%, RSI Overbought
On Juli 28, 2026: price 29.29 SGD, trend uptrend, RSI 79.6, support 24.66, resistance 29.18. technical analysis of ocbc stock. OCBC Stock Technicals — full…

OCBC Bank’s shares on SGX were last quoted at SGD 29.29, up 1.35% from the previous close, and the move pushed the stock just beyond its 20-session resistance at SGD 29.18, according to Yahoo Finance data as of 24 July 2026, 08:00 WIB. That matters because the stock is not merely rising; it is trading near the top of its recent range, with price sitting at 102% of the 20-session band and above both its short- and medium-term trend markers. The message from the chart is straightforward: buyers remain in control, but the pace of the advance is now running into momentum fatigue.
Trend & Price Action
The broader structure remains constructive. OCBC is in an uptrend, with the SMA20 at SGD 27.18 above the SMA50 at SGD 25.22, which means the shorter trend is still leading the longer one. That alignment is usually read as a sign that the market has not lost its upward bias. The fact that the price is also trading above the SMA20 tells us the latest pullback phase has not yet developed into a trend break.
What is notable, as shown in the chart, is that the stock has already travelled a long way in a short period. It is up 17.82% over one month, while the SMA20 slope is 3.76% over five days, a brisk angle that signals persistent demand rather than a one-day jump. The stock is also sitting at its 3-month high of SGD 29.18, which is a clear technical milestone: when a price reaches a fresh range high, it often attracts follow-through from momentum traders, but it can also invite profit-taking from holders who bought earlier in the move.
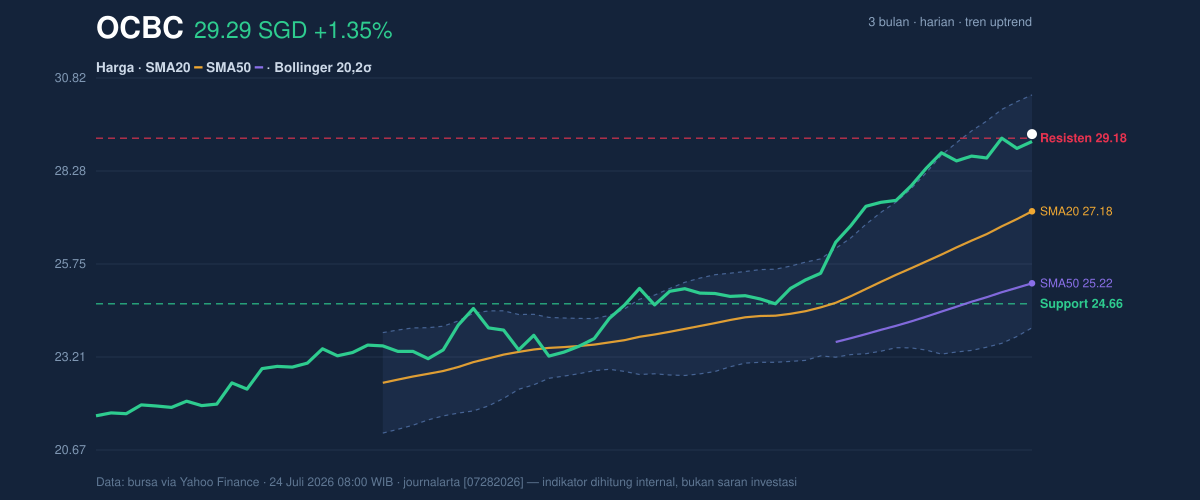
The Bollinger Bands help frame that tension. OCBC is trading near the upper band at SGD 30.36, with the middle band at SGD 27.18 and the lower band at SGD 24.00. A %B reading of 83% means the price is already deep in the upper portion of the band structure, which usually indicates strength, but also tells us the stock is no longer in a neutral zone. The band width of 23.4% shows volatility is expanding, so the market is giving itself room for a larger move in either direction.
Oscillators & Momentum
The momentum picture is strong, but stretched. The RSI at 79.6 and Stochastic %K at 97.6 versus %D at 96.8 both sit in overbought territory, which does not automatically mean a reversal is imminent. In plain language, it means the stock has been rising fast enough that short-term buyers may already be crowded in. When oscillators are this elevated, the next phase is often less about whether the trend is bullish and more about whether the stock can keep climbing without pausing.
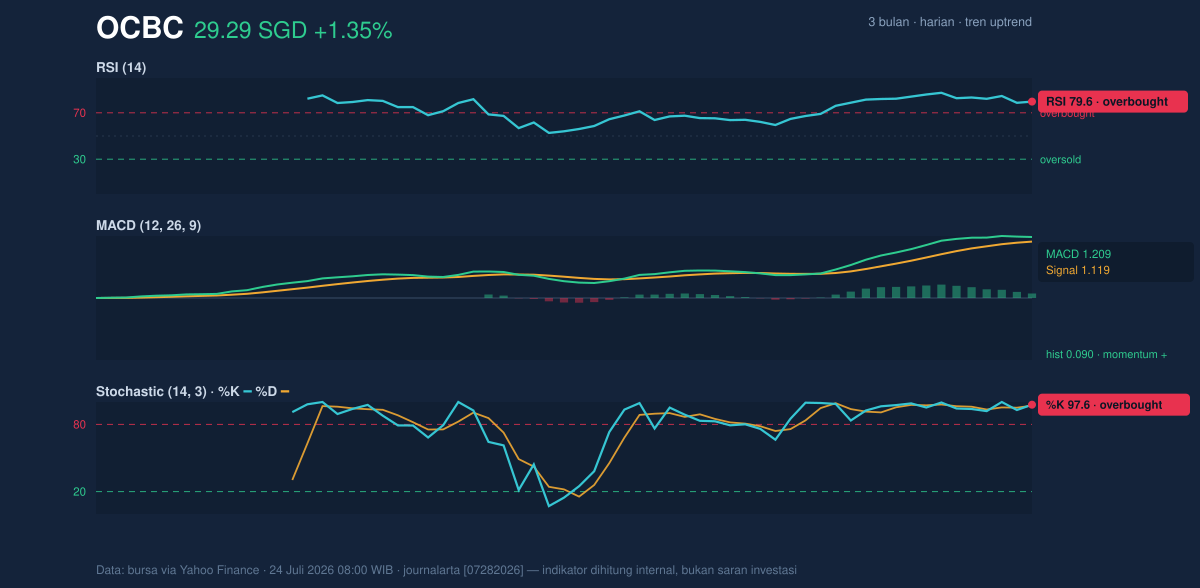
That said, the MACD still argues for upward momentum. The MACD at 1.209 is above the signal line at 1.119, leaving a positive histogram of 0.090. This tells us trend momentum is still expanding, even if it is no longer cheap on a short-term basis. In technical terms, the oscillator set is mixed: RSI and Stochastic are overbought, while MACD remains positive. That combination often appears late in an advance, when trend strength persists but the stock becomes more sensitive to any disappointment.
Volatility & Volume
Volatility is active, but not extreme by daily range standards. The ATR(14) of 0.62, equal to 2.1% of price, suggests the shares can still move meaningfully in a session, though not in a disorderly way. The wider Bollinger structure reinforces that point: the market is not compressed, so a breakout or pullback can develop with some force once direction is chosen.
Volume, however, adds a note of caution. The latest turnover of 4,831,300 shares was only 0.8x normal versus the 20-session average of 6,210,023. That means the move to the highs has not been powered by unusually heavy participation. In practical terms, price is advancing, but the crowd has not fully piled in. The OBV is rising, which is constructive because it shows volume flow still supports the trend over time, yet the latest session’s lighter trading suggests conviction is not as strong as the price alone might imply.
Key Levels & Scenarios
The immediate technical map is clear from the chart. Support sits at SGD 24.66, while resistance is SGD 29.18, with the upper Bollinger band at SGD 30.36 acting as the next visible ceiling if the stock extends further. Because OCBC is already trading above the 20-session resistance, the market is effectively testing whether that former cap can now turn into support. That is a classic signpost in trend analysis: once resistance is cleared, traders watch to see if the level holds on any pullback.
If the shares hold above SGD 29.18, the chart suggests the breakout remains intact and the upper band at SGD 30.36 becomes the next reference point. If price falls back below SGD 27.18, the SMA20 would become the first meaningful line of defense, and a deeper slip toward SGD 24.66 would signal that the recent advance is losing structure. The strongest warning sign would be a break below that support, because it would challenge both the recent range and the broader uptrend that has defined the stock’s latest phase.
Technical Verdict: HOLD (wait & see)
HOLD (wait & see) fits the current setup best because the trend is still positive, but the stock is also technically stretched after a sharp run. The MACD remains positive, which supports continuation, yet the RSI at 79.6 and Stochastic at 97.6/96.8 show the shares are overbought and vulnerable to a pause. The price above SMA20 and SMA50 confirms the uptrend, while the 0.8x volume reading says the latest push has not been backed by exceptional participation.
- Ideal entry range: SGD 27.18 to SGD 29.18, where the SMA20 and former resistance can act as reference zones.
- Exit target: SGD 30.36, the upper Bollinger Band.
- Stop loss protection: SGD 24.66, the 20-session support.
The setup still leans upward, but the stock is stretched enough that the next move matters more than the last one. The verdict would be invalidated if price breaks below SGD 24.66, which would undermine the current support structure. OCBC’s next scheduled technical test is whether SGD 29.18 can hold as support after the latest push to a 3-month high.
Summary Data OCBC
| Last price | 29.29 SGD |
| Change 1 day / 5 days / 1 month | 1.35% / 2.56% / 17.82% |
| Trend / MA-cross | uptrend / none |
| SMA20 / SMA50 | 27.18 / 25.22 |
| RSI (14) / Stochastic %K | 79.6 / 97.6 |
| Bollinger %B / ATR | 83% / 0.62 |
| Support / Resistance 20 days | 24.66 / 29.18 |
| Data as of | 24 Juli 2026 08:00 WIB |


