ORCL Stock Analysis: Gains 4.27%, Momentum Gains
On Juli 28, 2026: price 119.90 USD, trend downtrend, RSI 33.0, support 114.99, resistance 147.76. technical analysis of orcl stock. ORCL Stock Analysis — full…

Oracle is trading like a stock caught between a deep downtrend and a short-term rebound, with the latest move showing buyers stepping in from near the lower end of its range. On the New York Stock Exchange, ORCL closed at 119.90 USD, up from the previous close of 114.99, but the bigger picture still points to pressure: the shares are below the 20-day moving average at 132.98 and far under the 50-day moving average at 170.15.
Trend & Price Action
The chart shows a stock that has lost momentum over the past month, with a 1-month decline of 19.28% and a downtrend confirmed by the SMA20 slope of -6.70% over 5 days. That slope matters because it tells us the short-term average is still falling, so even a bounce can be treated cautiously until price starts holding above the trend line. The lack of a fresh moving-average crossover also suggests the market has not yet produced a clear reversal signal. In plain terms: the trend is still down, even though the latest session was stronger.
ORCL is sitting near the bottom of its recent trading band, not far above the 3-month low of 114.75 and well below the 3-month high of 250.25. The 20-hour support at 114.99 is especially important because the current price is only a small distance above it, which means the stock is still vulnerable if sellers regain control. At the same time, the 20-hour resistance at 147.76 marks the first meaningful ceiling where rallies could stall.
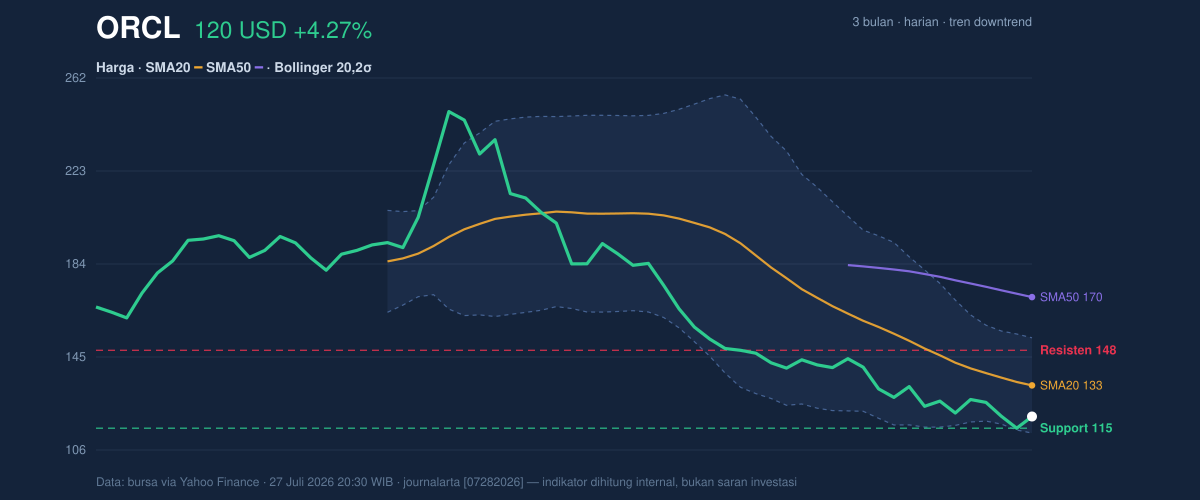
The Bollinger Bands reinforce that tension. With the middle band at 132.98, the upper band at 153.02, and the lower band at 112.93, price is trading in the lower part of the band structure, with %B at 17%. That reading means the stock is close to the lower band rather than the middle, which often signals oversold conditions — but not necessarily a reversal. The 30.1% band width shows the range has expanded, which usually means the market is expecting larger swings rather than calm trading.
Oscillators & Momentum
Momentum is mixed, and that is the key reason this name still looks technically fragile. The RSI(14) at 33.0 is described as neutral, but it is close to the oversold zone, which tells readers the stock has been weak enough to start attracting bargain-hunting interest. More importantly, the Stochastic %K at 15.0 and %D at 5.9 are oversold, meaning the latest price action is stretched to the downside on a short-term basis. That can support a rebound, but oversold conditions can also persist in a strong downtrend.
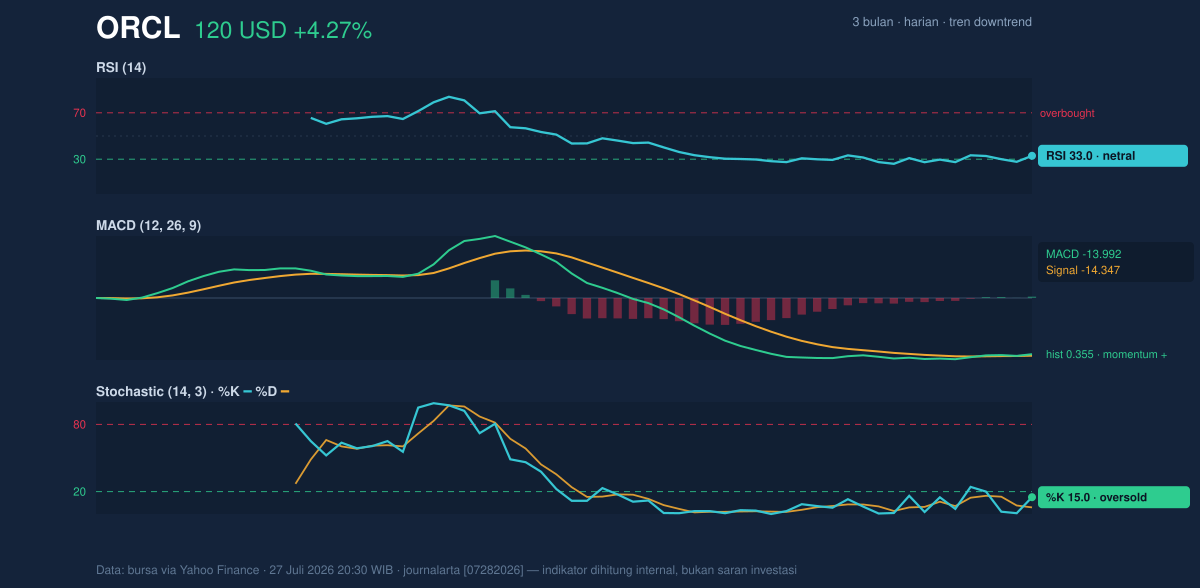
The MACD adds a more constructive nuance. With MACD at -13.992, signal at -14.347, and a positive histogram of 0.355, downside momentum is still negative in absolute terms, but the gap between MACD and signal line suggests the selling pressure is easing. In simple language, the stock is still weak, but the pace of weakness is slowing. That is not the same as a confirmed turn, yet it does explain why the latest bounce appeared while the broader trend remains damaged.
Volatility & Volume
Volatility is high, and that changes how the chart should be read. The ATR(14) at 6.70, or 5.6% of price, indicates Oracle can move sharply in a single session. For readers, ATR is a measure of typical daily movement, so a higher reading means wider swings and less room for complacency. The Bollinger Band width also points to expansion, which often accompanies a market trying to decide whether to continue lower or stage a more durable bounce.
Volume, however, does not yet confirm conviction. Last session’s volume of 36,783,500 was below the 20-hour average of 39,811,515, or about 0.9x normal. That matters because rebounds on lighter volume can be fragile if institutions are not participating. The OBV is falling, which means cumulative volume flow is still pointing toward distribution rather than accumulation. In other words, the latest price rise has not yet been backed by a clear shift in ownership behavior.
Key Levels & Scenarios
The chart’s most useful message is that Oracle is trapped between a nearby floor and a nearby ceiling. The support at 114.99 is the immediate line to watch, while 112.93 from the lower Bollinger Band offers a second technical reference if that floor gives way. On the upside, 132.98 is the first major checkpoint because it is both the 20-day average and the Bollinger midline, and 147.76 is the next resistance where rallies may meet supply.
If price can reclaim 132.98 and hold above it, that would suggest the rebound is doing more than just bouncing from oversold conditions. If it fails to hold 114.99, the chart would likely reopen the path toward the lower band at 112.93, with the broader downtrend still intact. The current position — roughly 15% into the 20-hour range — shows ORCL is not yet in a decisive breakout zone.
Technical Verdict: HOLD (wait & see)
HOLD (wait & see) fits best because the chart is oversold enough to support a rebound, but the trend is still down and volume is not confirming a durable turn. The strongest reasons are: price remains below SMA20 and SMA50, Stochastic is oversold while MACD histogram is positive, and OBV is still falling, which weakens the case for sustained accumulation. The verdict is invalidated if price breaks 114.99, because that would put the stock through immediate support and closer to the lower Bollinger Band at 112.93.
- Ideal Entry Range: 114.99 to 119.90, only if support at 114.99 continues to hold
- Exit Target: 132.98 first, then 147.76 if momentum strengthens
- Stop Loss protection: below 112.93, the lower Bollinger Band
For non-traders, this means Oracle looks stretched enough to bounce, but not yet strong enough to trust that bounce as a trend change.
“The market is still asking whether this is a floor — or just another pause in the slide.”
Summary Data ORCL
| Last price | 119.90 USD |
| Change 1 day / 5 days / 1 month | 4.27% / -1.22% / -19.28% |
| Trend / MA-cross | downtrend / none |
| SMA20 / SMA50 | 132.98 / 170.15 |
| RSI (14) / Stochastic %K | 33.0 / 15.0 |
| Bollinger %B / ATR | 17% / 6.70 |
| Support / Resistance 20 days | 114.99 / 147.76 |
| Data as of | 27 Juli 2026 20:30 WIB |

