Shell Momentum Gains: Stock Drops 2.00% (Juli 28, 2026)
On Juli 28, 2026: price 3,277.00 GBp, trend sideways, RSI 66.4, support 2,872.50, resistance 3,344.00. technical analysis of shell stock.

Shell plc’s shares on the LSE fell to 3,277.00 GBp on 24 July 2026, down 2.00% from the previous close of 3,344.00, even as the stock still trades above its short-term moving averages and within striking distance of its recent ceiling. The move matters because it shows a market that has been willing to pay up for Shell over the past month — the shares are still up 13.08% over that period — but is now pausing near the top of the current range, where momentum can start to outrun confirmation.
Trend & Price Action
The broader pattern remains sideways, not trending cleanly in one direction, and that is important because sideways structures often reflect a market that is digesting earlier gains rather than building a fresh leg higher. Shell’s price sits above SMA20 at 3,088.80 and above SMA50 at 3,120.69, which tells readers the recent advance has not been lost; the stock is still trading on the stronger side of its medium-term trend.
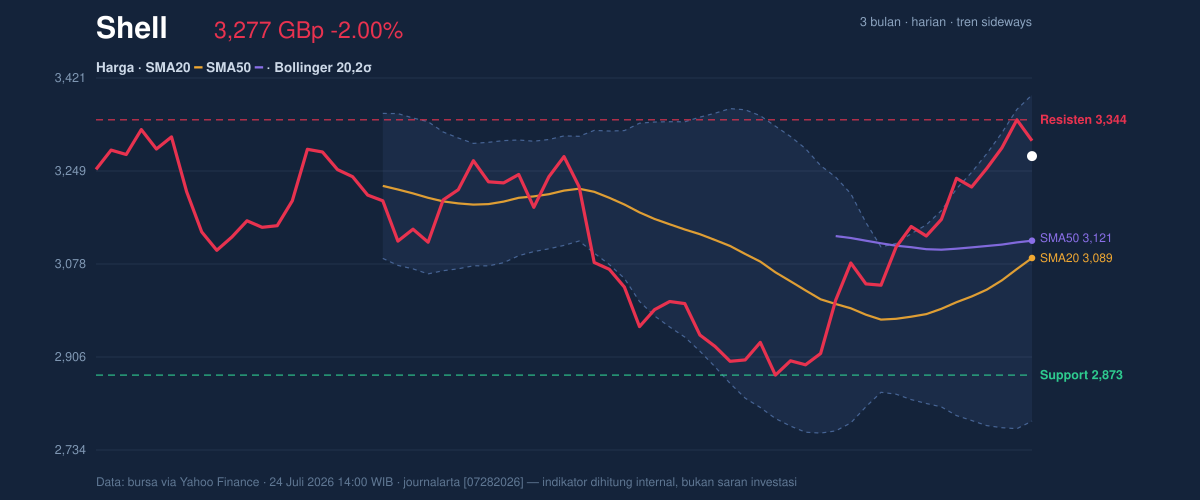
The lack of a new MA-cross means there is no fresh moving-average signal to confirm a breakout or a breakdown, so the chart is leaning on price behavior itself rather than a clean technical trigger. With the shares at 86% of the 20-day range, and the 20-day support at 2,872.50 versus resistance at 3,344.00, Shell is positioned near the upper end of its recent band, where gains can become harder to extend without new buying interest. The three-month range, from 2,559.50 to 3,758.50, shows there is still room above if buyers regain control, but also enough historical distance below to remind investors that this is not a one-way move.
Oscillators & Momentum
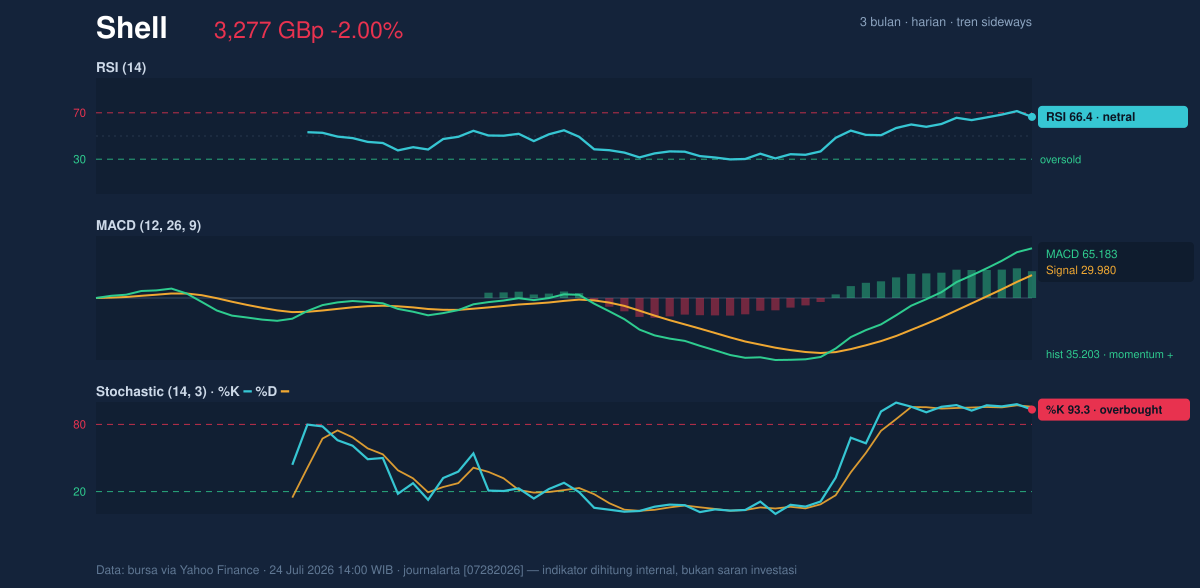
Momentum is mixed rather than uniformly strong. RSI at 66.4 is still described as neutral in this data set, which suggests the stock is not yet in a classic overbought reversal zone, but it is close enough to the upper band of normal momentum that traders will be watching for fatigue. The sharper warning comes from the Stochastic reading of 93.3 / 95.8, which is clearly overbought; in plain English, that means the latest price advance has moved ahead of itself in the short term, and the stock may need to cool off before another push higher.
That caution is partly offset by the trend-following signals. MACD at 65.183, well above its signal line at 29.980, with a histogram of 35.203, indicates positive momentum is still intact. In practical terms, MACD is saying the recent up-move is not just noise, even if the faster oscillator is flashing a warning that the rally may be stretched. The result is a familiar tension: the trend is constructive, but the short-term pace looks hot.
Volatility & Volume
The Bollinger setup reinforces that tension. Price is trading above the middle band at 3,088.80 and below the upper band at 3,389.99, with %B at 81%, which places Shell in the upper portion of its volatility envelope. That usually means the stock is strong, but also closer to the point where mean reversion — a move back toward the middle band — becomes more likely if momentum stalls. The 19.5% band width is described as normal, so this is not a squeeze waiting for an explosive release; instead, it suggests an ordinary volatility regime with enough room for swings, especially because ATR(14) is 132.79, or 4.1% of price, which is high. High ATR means daily movement can be wide, so even a modest headline or sector shift can produce a noticeable gap or reversal.
Volume adds an important nuance. Last volume was 7,460,298, below the 20-day average of 8,718,722, or about 0.9× normal. That tells us the latest drop was not backed by unusually heavy participation, which reduces the immediate urgency of the selloff. At the same time, OBV is rising, and that matters because on-balance volume tracks whether money flow is generally accumulating or distributing. Rising OBV alongside a price that is still near the top of its range suggests underlying demand has not disappeared, even if the latest session lacked conviction.
Key Levels & Scenarios
The market is now centered on whether Shell can defend the lower end of its recent support structure while challenging the top of the range. Support at 2,872.50 is the first line that matters, because a break below it would imply the recent advance has failed to hold its base. On the upside, 3,344.00 is the near-term resistance to watch, and it also matches the previous close, making it a clear reference point for whether buyers can reclaim control. Above that, the Bollinger upper band at 3,389.99 becomes the next technical marker, since a push through that area would show price is no longer merely testing resistance but expanding beyond its recent statistical range.
If Shell slips back under 3,088.80, the middle Bollinger band and SMA20, the tone would shift from constructive consolidation to a more fragile setup, because that would mean price has lost the pivot that has supported the recent recovery. If, instead, the stock reclaims 3,344.00 and holds above it, the chart would start to look less like a pause and more like continuation.
Technical Verdict: HOLD (wait & see)
HOLD (wait & see)
- RSI at 66.4 is still supportive, but not decisive, and the Stochastic at 93.3 / 95.8 is overbought, warning that the short-term move may be stretched.
- MACD remains positive with the histogram above zero, which supports the broader up-move, while price above SMA20 and SMA50 keeps the medium-term structure constructive.
- Price near 86% of the range and close to 3,344.00 resistance means upside needs confirmation, not assumption.
- Verdict invalidated if price breaks below 2,872.50.
- Ideal entry range: 3,088.80 to 3,120.69
- Exit target: 3,344.00 to 3,389.99
- Stop loss protection: 2,872.50
In plain English, Shell still looks firm, but the chart is asking for proof before the next leg higher can be trusted.
“The market has not broken the trend, but it has clearly started to test the patience of anyone waiting for a clean breakout.”
Summary Data Shell
| Last price | 3,277.00 GBp |
| Change 1 day / 5 days / 1 month | -2.00% / 1.27% / 13.08% |
| Trend / MA-cross | sideways / none |
| SMA20 / SMA50 | 3,088.80 / 3,120.69 |
| RSI (14) / Stochastic %K | 66.4 / 93.3 |
| Bollinger %B / ATR | 81% / 132.79 |
| Support / Resistance 20 days | 2,872.50 / 3,344.00 |
| Data as of | 24 Juli 2026 14:00 WIB |

