Singtel Testing Key Resistance: Stock Drops 0.90% (Juli 28, 2026)
On Juli 28, 2026: price 4.42 SGD, trend sideways, RSI 46.8, support 4.37, resistance 4.47. technical analysis of singtel stock. Singtel Testing Key Resistance…

Singapore Telecom’s shares on the SGX slipped to SGD 4.42 on 24 July, edging below the previous close of SGD 4.46 as the stock continued to trade in a narrow band. The move leaves Singtel in a sideways pattern, but the details matter: price is sitting right on the SMA20 at SGD 4.42 and just under the SMA50 at SGD 4.44, a setup that shows indecision rather than a clean trend break.
Trend & Price Action
The chart shows a stock that is not trending strongly in either direction, yet is not drifting aimlessly either. The price below the SMA20 and slightly under the SMA50 suggests short-term momentum has softened, but the gap is small enough to indicate a market still testing balance rather than confirming a deeper downtrend. With the MA-cross unchanged, there is no fresh moving-average signal telling traders that control has decisively shifted.
The broader range also frames the mood. Singtel is trading around the middle of its 20-hour range, with support at SGD 4.37 and resistance at SGD 4.47. That midpoint position usually signals a wait-and-see market: buyers have not surrendered the floor, but sellers have not yet been forced to retreat. The stock is also well below its 3-month high of SGD 5.05 and above the 3-month low of SGD 4.15, which means it remains inside a broader consolidation zone rather than at an extreme.
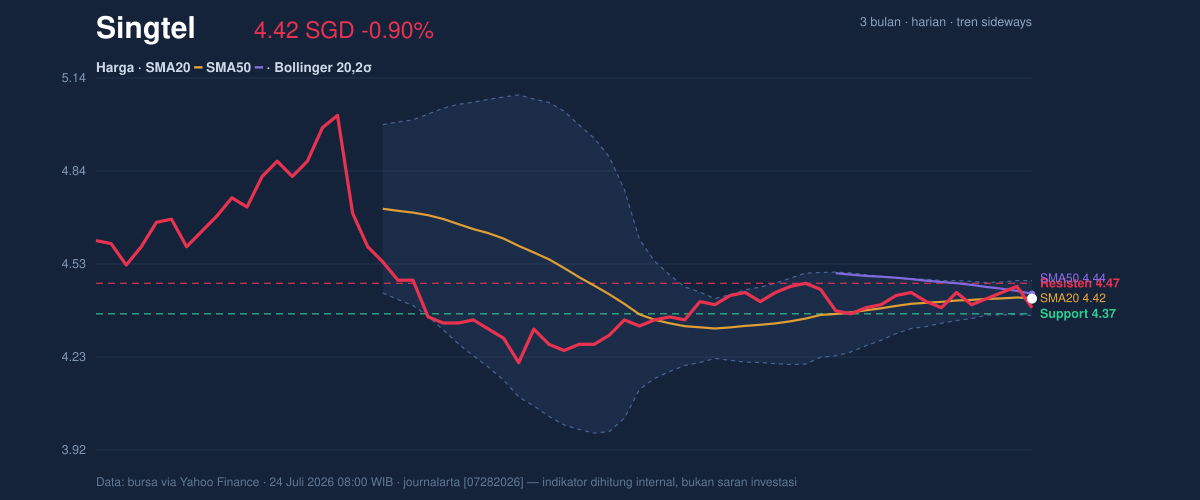
The Bollinger Bands reinforce that picture. Price is near the middle band, with the upper band at SGD 4.48 and the lower band at SGD 4.36, while the band width of 2.6% is narrowing. A squeeze like this often means the market is storing energy for a larger move, but it does not tell the direction by itself. What it does tell readers is that the current calm may not last long if volume expands and price leaves the banded range.
Oscillators & Momentum
Momentum is mixed, but not weak enough to justify a bearish reading on its own. The RSI at 46.8 sits in neutral territory, which means the stock is neither overbought nor oversold. In plain language, traders are not chasing the name aggressively, but they are also not dumping it in a panic.
The stochastic indicator is softer. With %K at 33.3 and %D at 60.7, the shorter line is below the signal line, which usually points to fading near-term momentum. Yet the reading is still neutral rather than oversold, so this looks more like hesitation than a confirmed reversal. The more constructive signal comes from MACD at 0.001 versus signal at -0.002, leaving a positive histogram of 0.003. That combination suggests underlying momentum has turned slightly positive, even if price has not yet broken away from its tight range.
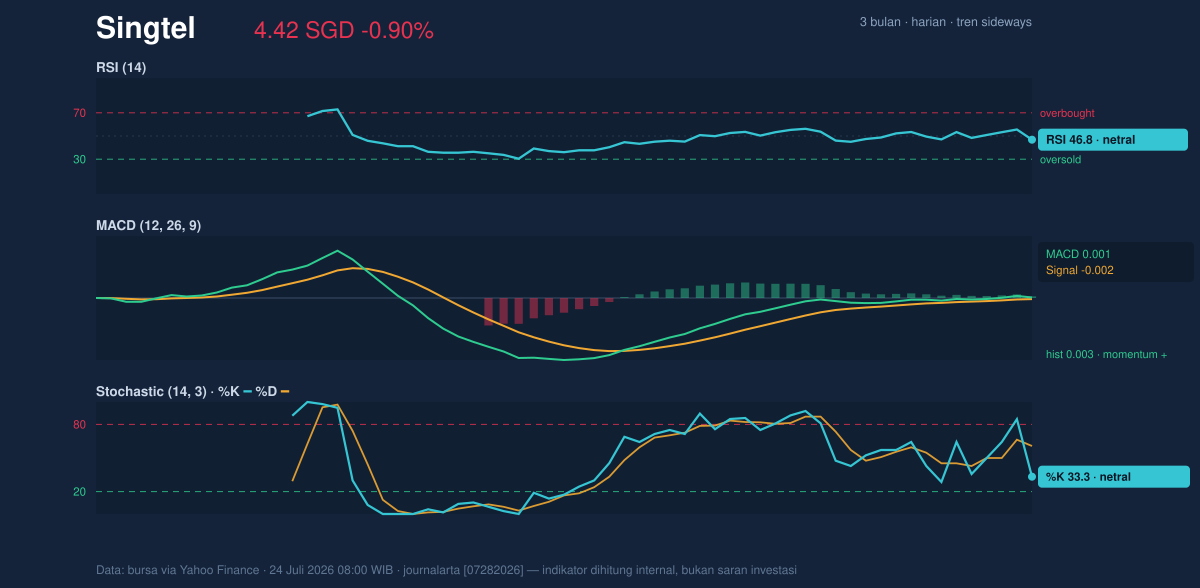
The key takeaway from the oscillator mix is that Singtel is neither overheated nor broken. RSI and stochastic say the stock is still searching for direction, while MACD says the internal momentum has improved enough to keep the bulls in the conversation. When indicators disagree like this, the market is usually waiting for price to confirm which side is in charge.
Volatility & Volume
Volatility is moderate. The ATR of 0.07, equal to 1.6% of price, suggests daily movement is contained, not explosive. That matters because in a squeeze environment, a stock with moderate ATR can still move sharply once it exits the range, but until then the tape often stays compressed.
Volume is giving a mild confirmation signal. Last volume of 29,478,500 was about 1.1× normal against the 20-hour average of 27,991,095, so participation is slightly better than usual. More importantly, OBV is rising, which implies that volume has been favoring accumulation rather than distribution. In practical terms, buyers are not flooding in, but they are active enough to prevent a decisive breakdown so far. That combination of steady volume and rising OBV is usually more constructive than a flat or falling participation profile.
Key Levels & Scenarios
The immediate map is clear. SGD 4.37 is the nearest support, while SGD 4.47 is the first resistance to watch. Above that, the upper Bollinger band at SGD 4.48 becomes the next technical marker, because it would show price pushing out of the current compression zone. On the downside, a failure to hold SGD 4.36 would matter because it aligns with the lower band and would suggest the squeeze is resolving lower.
If price reclaims SGD 4.44 and then clears SGD 4.47, the chart would begin to look less like a stalled range and more like an attempt to reassert short-term strength. If instead it slips under SGD 4.37, the market would be signaling that the balance has tilted away from buyers, with the lower Bollinger band and the 3-month low of SGD 4.15 becoming more relevant.
Technical Verdict: HOLD (wait & see)
HOLD (wait & see) is the cleanest reading because the stock is boxed in by nearby moving averages, momentum is mixed, and Bollinger Bands are tightening. The setup is not bearish enough for a sell-style reading, but it is not strong enough to call a clean upside breakout either.
Reasons:
- Price is below the SMA20 and SMA50, which shows short-term softness, but only by a small margin.
- RSI at 46.8 and stochastic 33.3/60.7 are neutral, so momentum has not confirmed a directional move.
- MACD is slightly positive and OBV is rising, which prevents a bearish verdict and keeps the range-biased case intact.
Verdict invalidated if price breaks below SGD 4.36, because that would mean the lower Bollinger band and nearby support have failed together.
- Ideal Entry Range: SGD 4.37 to SGD 4.42
- Exit Target: SGD 4.47 to SGD 4.48
- Stop Loss Protection: below SGD 4.36
In plain English, Singtel is sitting in a tight holding pattern, and the next meaningful move will likely come only after it leaves the SGD 4.37 to SGD 4.48 band.
Volume last: 29,478,500, above the 20-hour average of 27,991,095.
Summary Data Singtel
| Last price | 4.42 SGD |
| Change 1 day / 5 days / 1 month | -0.90% / -0.45% / -0.23% |
| Trend / MA-cross | sideways / none |
| SMA20 / SMA50 | 4.42 / 4.44 |
| RSI (14) / Stochastic %K | 46.8 / 33.3 |
| Bollinger %B / ATR | 49% / 0.07 |
| Support / Resistance 20 days | 4.37 / 4.47 |
| Data as of | 24 Juli 2026 08:00 WIB |


