UOB Stock Gains 1.16%, Momentum Weakens In Focus
On Juli 28, 2026: price 43.50 SGD, trend uptrend, RSI 63.2, support 39.65, resistance 44.95. technical analysis of uob stock. UOB Stock Gains — full details…

United Overseas Bank’s shares on SGX were last quoted at SGD 43.50 on 24 July 2026, extending a short-term rise even as the stock sits just below a nearby ceiling at SGD 44.95. The move is constructive because price remains above both the SMA20 at 42.40 and the SMA50 at 40.02, but the tape is not showing full conviction yet: trading volume was only 0.5x the 20-day average, while the MACD has slipped into negative territory. In plain terms, UOB is still in an uptrend, but the latest push looks more like a measured climb than a breakout sprint.
Trend & Price Action
The chart shows a stock that is still trading in the upper half of its recent range, with price positioned at about 73% of the 20-hour range. That matters because it suggests buyers have kept control for most of the session, even if they have not yet forced a decisive move through resistance. The broader structure also remains supportive: price is above the SMA20 and well above the SMA50, which tells readers the medium-term trend is still pointing higher.
The slope of the SMA20, up 1.90% over 5 days, reinforces that message. A rising short-term average usually means recent buying has been strong enough to pull the trend line upward, and that often acts as a dynamic floor on pullbacks. There is no fresh moving-average cross to narrate here, so the signal is less about a dramatic trend shift and more about trend persistence.
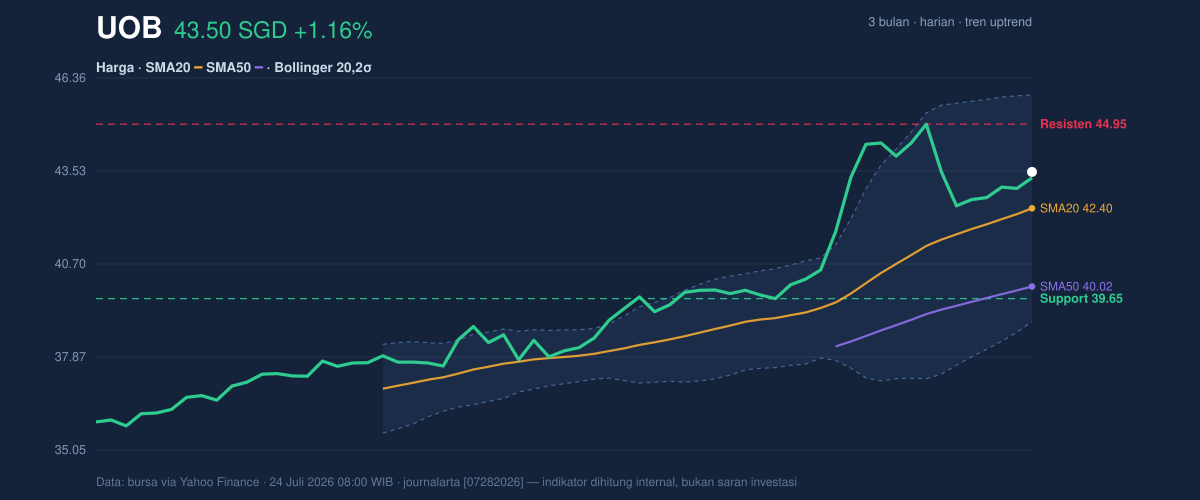
The key question is whether UOB can turn SGD 44.95 resistance into support. If it does, the stock would be signaling that buyers are willing to pay progressively higher prices rather than simply defending gains. If it fails, the current rise can still hold, but momentum would remain capped beneath that level.
Oscillators & Momentum
The momentum picture is more mixed than the trend picture, and that is important. RSI at 63.2 is still neutral by the data provided, which means the stock is not overbought and does not look stretched enough to force an immediate reversal. Stochastic %K at 59.2 and %D at 58.3 are also neutral, showing no sharp divergence between fast and slow momentum gauges. Those readings fit a market that is advancing without obvious excess.
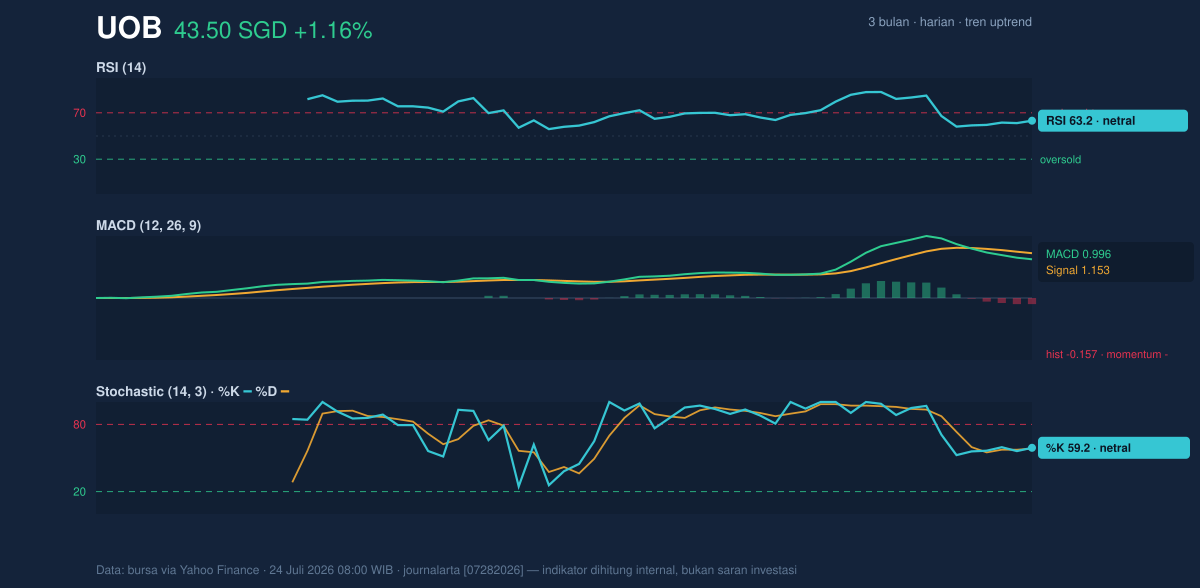
The caution flag comes from the MACD. With MACD at 0.996, below the signal line at 1.153, and a histogram of -0.157, the short-term momentum engine is losing some pace. In practical terms, that does not mean the trend has broken; it means the latest upward move is not yet being confirmed by acceleration. Traders often read that as a pause risk: price can still rise, but the path may become choppier unless MACD turns back above its signal line.
This is why the chart deserves a nuanced read. Trend indicators lean positive, while oscillators are neutral and MACD is slightly negative. That combination usually points to a market that is healthy enough to hold gains, but not yet strong enough to guarantee immediate continuation.
Volatility & Volume
Bollinger Bands frame the current move in a useful way. Price is trading above the middle band at 42.40 and below the upper band at 45.84, with %B at 66%. That places UOB in the upper part of its volatility envelope, but not at an extreme. The 16.3% band width is described as normal, which suggests the stock is not in a squeeze or a volatility breakout phase. In other words, the market is not coiling tightly for a sudden expansion, nor is it already in an overstretched surge.
ATR adds another layer. At 1.05, or 2.4% of price, volatility is moderate. That means day-to-day swings are present, but not unusually violent. For readers, the practical meaning is that a move through nearby resistance would likely need real participation rather than just a thin, noisy push.
That participation has not fully arrived yet. Volume of 1,831,401 was well below the 3,477,167 20-day average, and that lighter turnover weakens the force of the latest advance. Still, OBV is rising, which suggests the broader flow of shares has been net supportive over time even if the most recent session was quiet. The message is straightforward: the stock is climbing, but the market is doing so with subdued urgency.
Key Levels & Scenarios
The nearest support sits at SGD 39.65, and that level matters because it marks the lower edge of the recent 20-hour range. If price retreats but holds above that point, the uptrend remains structurally intact. Below it, the chart would begin to lose its near-term shape.
Resistance is clearer at SGD 44.95, with the upper Bollinger band at 45.84 providing the next technical ceiling. A move through both would indicate that the stock is no longer just drifting upward inside a familiar band, but is instead expanding into a stronger leg higher. The 3-month high at 45.15 sits close to that area, which makes the zone especially important: it is where recent buyers may meet prior sellers.
The broader 3-month low at 35.74 remains far below current price, which confirms that the prevailing trend has already recovered materially from earlier weakness. That is part of why the current setup still leans positive despite the softer MACD.
Technical Verdict: HOLD (wait & see)
- Strongest reasons:
- Price is above the SMA20 and SMA50, keeping the trend constructive.
- RSI and Stochastic are neutral, so the stock is not showing an overbought warning.
- MACD is below its signal line and volume is light, which limits confirmation of the latest rise.
- Verdict invalidated if price breaks/falls below SGD 39.65.
- Ideal Entry Range: SGD 42.40 to SGD 43.50
- Exit Target: SGD 44.95 to SGD 45.84
- Stop Loss protection: below SGD 39.65
In plain English, the chart says UOB is still rising, but the next move needs stronger volume and momentum before the advance looks fully convincing. The next scheduled reference point is whether price can challenge SGD 44.95 and the SGD 45.84 band ceiling.
Summary Data UOB
| Last price | 43.50 SGD |
| Change 1 day / 5 days / 1 month | 1.16% / 2.43% / 9.30% |
| Trend / MA-cross | uptrend / none |
| SMA20 / SMA50 | 42.40 / 40.02 |
| RSI (14) / Stochastic %K | 63.2 / 59.2 |
| Bollinger %B / ATR | 66% / 1.05 |
| Support / Resistance 20 days | 39.65 / 44.95 |
| Data as of | 24 Juli 2026 08:00 WIB |


