Alibaba Stock Technicals Today: Gains 1.82%, Momentum Gains
On Juli 29, 2026: price 112.00 HKD, trend sideways, RSI 51.3, support 92.85, resistance 117.00. technical analysis of alibaba stock. Alibaba Stock Technicals —…

Alibaba Group’s Hong Kong-listed shares rose to 112.00 HKD on HKEX, up 1.82% from the previous close of 110.00, but the move still sits inside a broader sideways structure, with the stock trading above SMA20 at 106.98 yet below SMA50 at 113.23. That placement matters: it says the rebound has regained short-term footing, but the medium-term trend has not fully turned, and the market is still testing whether recent strength can become something more durable. As shown in the chart, price is also near the upper half of its recent band rather than breaking decisively beyond it.
Trend & Price Action
The most important signal in the price structure is that Alibaba is no longer weak enough to be pressing the lower edge of its range, but it is also not strong enough to clear the next overhead barrier with conviction. The stock is above the 20-day average, which usually indicates the latest wave of buying has pushed price back into the short-term trend lane. Yet the 50-day average at 113.23 remains just above the current quote, acting as a practical ceiling because many systematic traders watch that line as a marker of whether a rebound has matured into a broader trend change.
There is no fresh moving-average crossover, so the chart does not yet show a clean trend reversal signal. Instead, the message is more cautious: momentum improved enough to lift the stock off the lower part of its range, but not enough to force a breakout regime. The 20-day average is rising, with a 3.92% slope over 5 days, which tells readers the short-term trend is still pointing upward even if the wider pattern is only sideways. In plain terms, the stock is climbing, but it has not escaped the box.
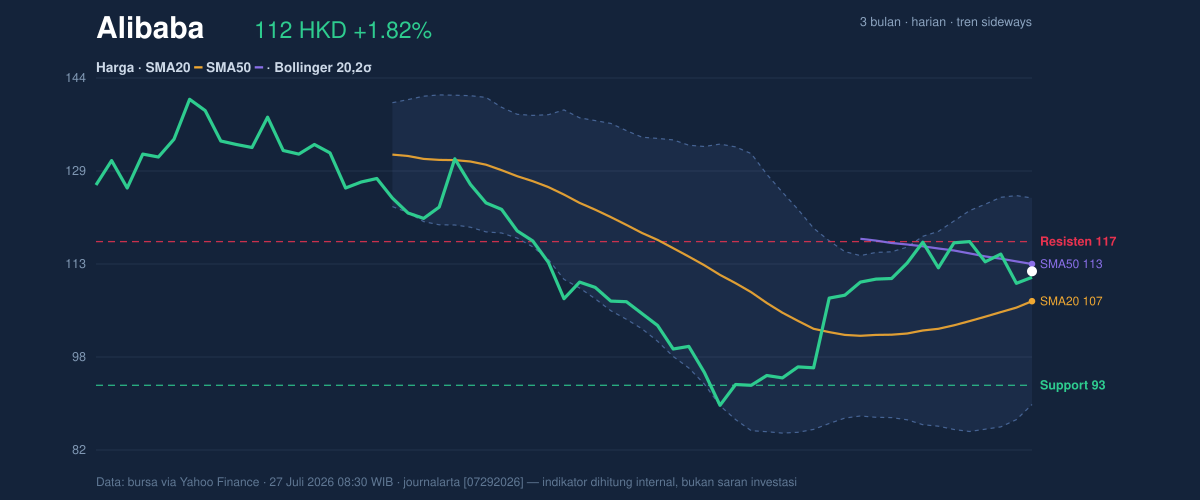
The 20-hour support at 92.85 and resistance at 117.00 frame the current debate neatly. At 112.00, Alibaba is sitting at roughly 79% of that range, meaning the market has already priced in a good part of the rebound and now needs follow-through to justify higher levels.
Oscillators & Momentum
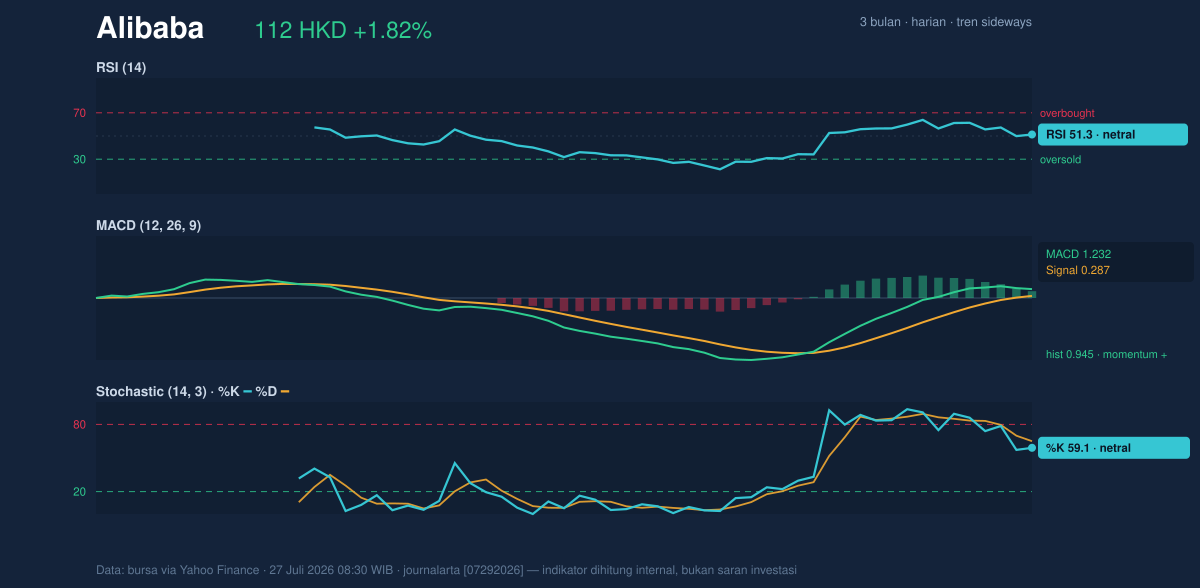
Momentum indicators are broadly constructive, but not euphoric. The RSI at 51.3 is neutral, which is important because it suggests the rally has not yet reached an overbought condition that often precedes a pause. Stochastic readings at 59.1 / 65.0 are also neutral, showing near-term momentum is positive but not stretched. That combination usually points to a market that has room to move, provided price continues to attract participation.
The stronger clue comes from MACD. With MACD at 1.232, above the signal line at 0.287, and a histogram of 0.945, the chart is showing positive momentum confirmation. For general readers, MACD measures whether short-term price movement is outpacing longer-term movement; when it sits above its signal line, it often means the recent upswing still has internal energy. The key nuance here is that the oscillators are not chasing the move—they are supporting it. That is a healthier setup than a rally already flashing overbought warnings.
Volatility & Volume
Volatility is elevated, and that changes how traders interpret every move. Bollinger Bands are wide, with the upper band at 124.32 and the lower band at 89.64, while the band width stands at 32.4% and is explicitly expanding. A widening band usually means the market expects larger price swings, not a quiet drift. The current %B at 64% shows price is above the middle of the band but still well short of the upper boundary, so the stock is leaning bullish without looking overextended.
ATR, a measure of average daily movement, is 5.98, or 5.3% of price, which confirms the stock can travel quickly in either direction. That matters because a technically positive setup can still whip around sharply before it resolves.
Volume is the caution flag. Last volume was 58,415,973, only 0.5× the 20-hour average of 115,034,593. In other words, the price rise happened on light participation, which weakens the immediate quality of the move. The encouraging counterpoint is that OBV is rising, meaning the broader flow of volume has been accumulating over time even if the latest session was quiet. That divergence suggests buyers have not disappeared, but they have not yet shown force in the latest push.
Key Levels & Scenarios
The chart’s structure is straightforward. Immediate support sits at 106.98, the SMA20 and Bollinger middle band, making it the first line that must hold for the rebound to remain intact. Below that, the broader support zone around 92.85 is the deeper floor from the 20-hour range. On the upside, the first test is 113.23 at the SMA50, followed by 117.00 resistance and then 124.32 at the upper Bollinger band.
If price clears 113.23 and then 117.00, the chart would begin to shift from a rebound inside a range toward a more convincing continuation. If it fails at the 50-day average and slips back under 106.98, the move would look more like a short-lived bounce within a sideways market. The deeper failure point is 92.85; losing that level would undo much of the recent recovery structure.
Technical Verdict: HOLD (wait & see)
HOLD (wait & see)
- MACD is positive, showing momentum is still supportive.
- RSI and Stochastic are neutral, which leaves room for movement but does not confirm a breakout.
- Price is above SMA20 but below SMA50, a classic in-between setup that needs confirmation.
- Verdict invalidated if price falls below 106.98.
- Ideal Entry Range: 106.98 to 113.23
- Exit Target: 117.00, then 124.32
- Stop Loss protection: below 106.98, with deeper protection at 92.85
In plain English: the chart is improving, but Alibaba still needs to prove the rebound is real.
Alibaba’s 3-month high stands at 144.00 and its 3-month low at 88.65.
Summary Data Alibaba
| Last price | 112.00 HKD |
| Change 1 day / 5 days / 1 month | 1.82% / -4.11% / 25.14% |
| Trend / MA-cross | sideways / none |
| SMA20 / SMA50 | 106.98 / 113.23 |
| RSI (14) / Stochastic %K | 51.3 / 59.1 |
| Bollinger %B / ATR | 64% / 5.98 |
| Support / Resistance 20 days | 92.85 / 117.00 |
| Data as of | 27 Juli 2026 08:30 WIB |


