BP Stock Technicals Today: Drops 4.14%, Momentum Gains
On Juli 29, 2026: price 525.70 GBp, trend sideways, RSI 58.4, support 455.60, resistance 555.90. technical analysis of bp stock. BP Stock Technicals — full…

BP plc’s London shares are holding above key averages, but the latest drop shows the market is still testing whether this recovery has enough fuel to extend. The stock closed at 525.70 GBp on 27 July 2026, down 4.14% on the day, even after gaining 11.21% over the past month.
Trend & Price Action
The broad picture is still one of recovery rather than a clean breakout. BP is trading above its SMA20 at 501.90 and above its SMA50 at 515.40, which matters because shares above both short- and medium-term averages usually mean buyers have regained control after a weaker patch. But the trend is only described as sideways, and that is the key signal: the market is not yet committing to a strong directional move.
The lack of a fresh MA-cross — no new moving-average crossover — suggests the recent lift is more about price stabilising above support than a decisive trend change. The SMA20 slope is 3.14% over 5 days, which points to improving short-term momentum, but not a runaway advance. As shown in the chart, price is sitting in the upper part of its recent band, at about 70% of the 20-hour range, which means the stock is closer to resistance than support.
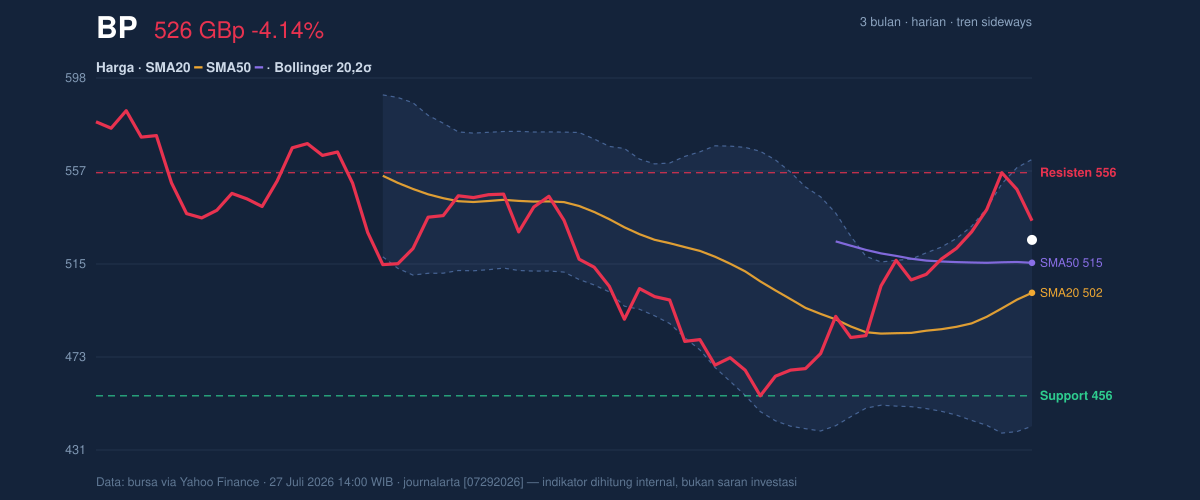
The 3-month structure gives the same mixed message. BP is well above the 3-month low of 450.60, but still below the 3-month high of 592.00. That places the shares in the middle-to-upper section of the broader range — constructive, but not yet in a confirmed breakout zone.
Oscillators & Momentum
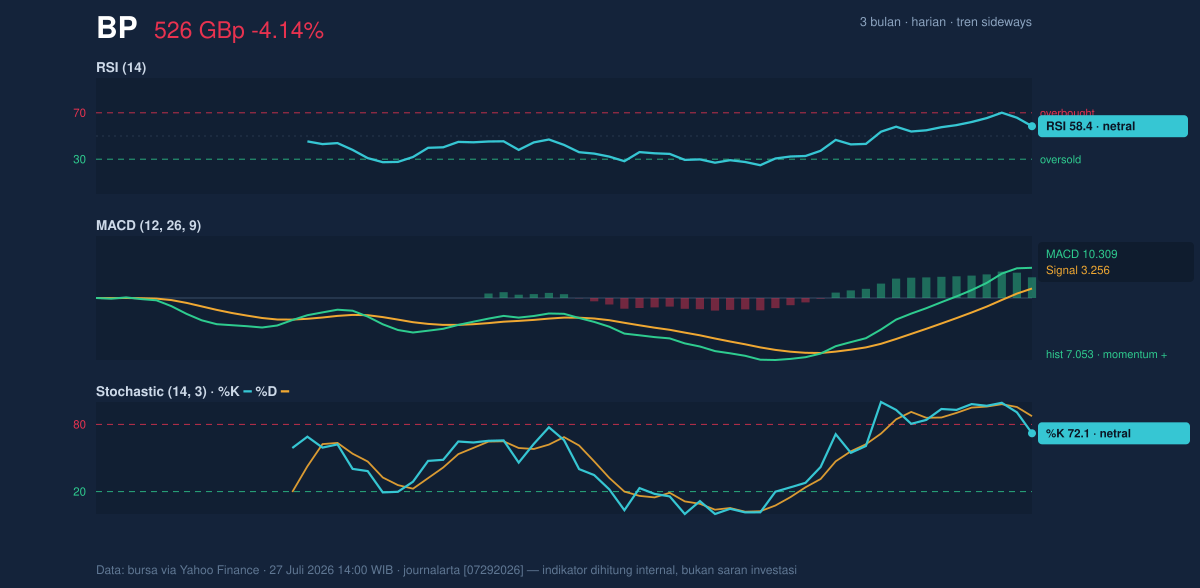
Momentum indicators are mostly supportive, though not stretched enough to imply a clean continuation without hesitation. The RSI at 58.4 is neutral, which usually means the market is neither overbought nor oversold. In plain terms, there is still room for further upside, but no strong momentum warning that the move is overheated.
The Stochastic reading of 72.1 / 87.4 is more nuanced. The %K line is elevated, and the %D line is even higher, which can indicate price is near the upper end of its recent trading rhythm. That does not automatically mean reversal, but it does suggest the stock may need a pause before it can extend higher. In other words, the oscillator is leaning toward strength, but not the kind that usually powers a straight-line move.
The clearest positive signal comes from MACD. With MACD at 10.309, above the signal line at 3.256, and a histogram of 7.053, momentum is still positive. That histogram gap tells readers that the bullish impulse remains in place: the trend is not just higher, it is still accelerating relative to its signal line. As shown in the chart, that is the strongest technical confirmation in the current setup.
Volatility & Volume
Volatility is not low, and that matters for how traders read the next move. The Bollinger Band envelope is wide, with the upper band at 561.90 and the lower band at 441.90, and the band width at 23.9% signals expanding volatility. Wider bands often mean the market is preparing for a larger swing, not settling into a calm range.
The price sits at %B 70%, which means it is trading above the midpoint of the Bollinger structure and leaning toward the upper band without touching it. That is consistent with a constructive tone, but also a reminder that upside may face friction before the upper band is reached.
Volume adds important confirmation. Last trade volume was 76,600,229, compared with a 20-day average of 39,936,993, or 1.9× normal activity. That is not background noise; it shows participation. When a move is backed by heavier volume, it usually carries more credibility than a drift on thin trading. The OBV is rising, which reinforces that buyers have been accumulating rather than distributing shares. ATR at 14.52, or 2.8% of price, suggests daily swings are meaningful but still manageable — enough to create movement, not enough to imply disorder.
Key Levels & Scenarios
The nearest reference points are straightforward. Support at 455.60 is the lower edge of the 20-hour range, while resistance at 555.90 caps the near-term upside. The stock is currently above the midpoint of that range, which gives it a slightly better-than-even technical posture, but it also means the next test is likely overhead rather than below.
A push through 555.90 would put the upper Bollinger band at 561.90 into view, and that would be the first signal that the recent recovery is trying to turn into a stronger advance. If price fails to hold above 515.40, the SMA50, the tone would weaken quickly because that average is acting as the medium-term line separating recovery from consolidation. Below that, the market would begin to lean back toward the 501.90 SMA20 and then the 455.60 support zone.
Technical Verdict: HOLD (wait & see)
HOLD (wait & see) is the cleanest read from the current setup.
- MACD is positive, with the line above the signal and a strong histogram, which supports the idea that upside momentum is still alive.
- Price is above SMA20 and SMA50, a constructive structure that keeps BP in recovery mode rather than breakdown mode.
- Bollinger Bands are widening, and volume is running at 1.9× average with OBV rising, showing participation behind the move.
Verdict invalidated if price falls below 515.40, because that would put BP back under the SMA50 and weaken the current recovery structure.
- Ideal Entry Range: 515.40 to 501.90
- Exit Target (Target Price): 555.90 to 561.90
- Stop Loss protection: below 501.90, with deeper protection at 455.60
For non-traders: BP’s chart still looks constructive, but the next move needs confirmation above resistance before the recovery can be treated as stronger than a pause.
Summary Data BP
| Last price | 525.70 GBp |
| Change 1 day / 5 days / 1 month | -4.14% / 0.73% / 11.21% |
| Trend / MA-cross | sideways / none |
| SMA20 / SMA50 | 501.90 / 515.40 |
| RSI (14) / Stochastic %K | 58.4 / 72.1 |
| Bollinger %B / ATR | 70% / 14.52 |
| Support / Resistance 20 days | 455.60 / 555.90 |
| Data as of | 27 Juli 2026 14:00 WIB |



