DBS Stock Drops 0.63% Today, RSI Overbought
On Juli 29, 2026: price 73.91 SGD, trend uptrend, RSI 76.2, support 65.43, resistance 74.38. technical analysis of dbs stock. DBS Stock Drops — full details…

DBS Group’s shares on SGX slipped to SGD 73.91, down 0.63% from the previous close of SGD 74.38, even after a strong 13.01% gain over the past month, according to data from Yahoo Finance as of 28 July 2026, 08:00 WIB. The stock is still in an uptrend, with price holding above both the SMA20 at SGD 70.87 and the SMA50 at SGD 66.67, but the chart is now showing a more important question than direction: how much of the recent advance is already priced in. As shown in the chart, DBS is trading near the top of its recent band, which often means momentum remains intact even as the room for easy gains narrows.
Trend & Price Action
The broader structure remains constructive. The stock is above its short- and medium-term moving averages, and the SMA20 slope of 2.92% over 5 days signals that the near-term trend is still rising rather than flattening out. That matters because a rising SMA20 usually reflects sustained buying interest, not just a one-day spike. Yet the market is also telling a different story at the margin: DBS sits at 95% of its 20-day range, with support at SGD 65.43 and resistance at SGD 74.38. In plain terms, the shares are pressing right against the ceiling of the recent trading band.
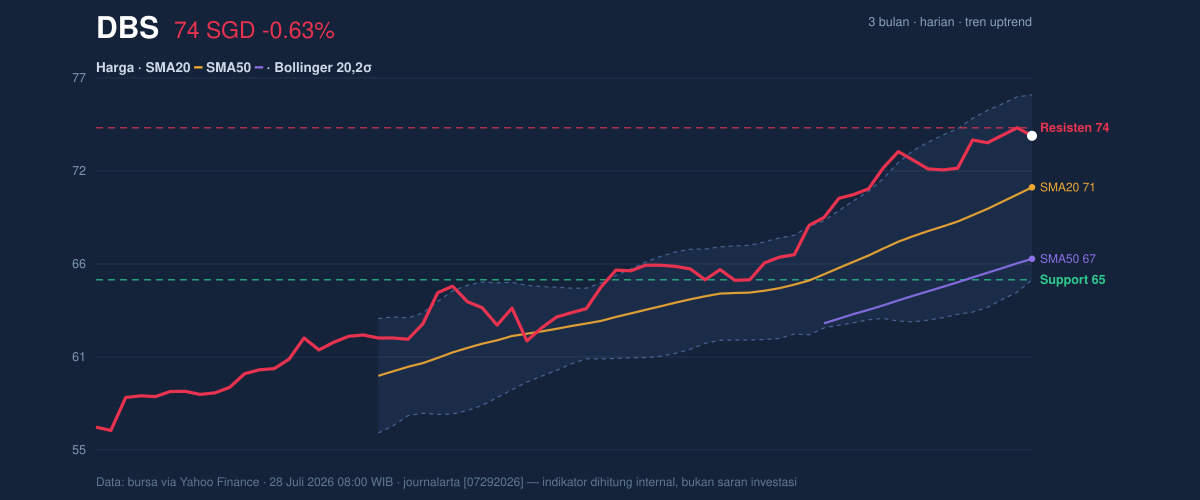
That positioning is important. A stock can remain strong while still being vulnerable to consolidation, especially when it is already close to a recent high. DBS has matched its 3-month high of SGD 74.38, so the market is not discovering a new trend here; it is deciding whether to extend an existing one.
Oscillators & Momentum
The momentum picture is firmer than the price action alone suggests, but it is also stretched. The RSI at 76.2 is in overbought territory, while Stochastic readings of %K 90.6 and %D 96.9 are also overbought. For general readers, that does not mean the stock must fall immediately; it means the pace of recent buying has been strong enough that the market may be running hot. Overbought readings often appear near the top of an advance, where momentum is still positive but the probability of pauses, pullbacks, or sideways trading rises.
The MACD tells a more supportive story. With MACD at 2.287, above the signal line at 2.207, and a positive histogram of 0.080, the trend-following indicator still points to upward momentum. In other words, price is extended, but the trend engine has not yet stalled.
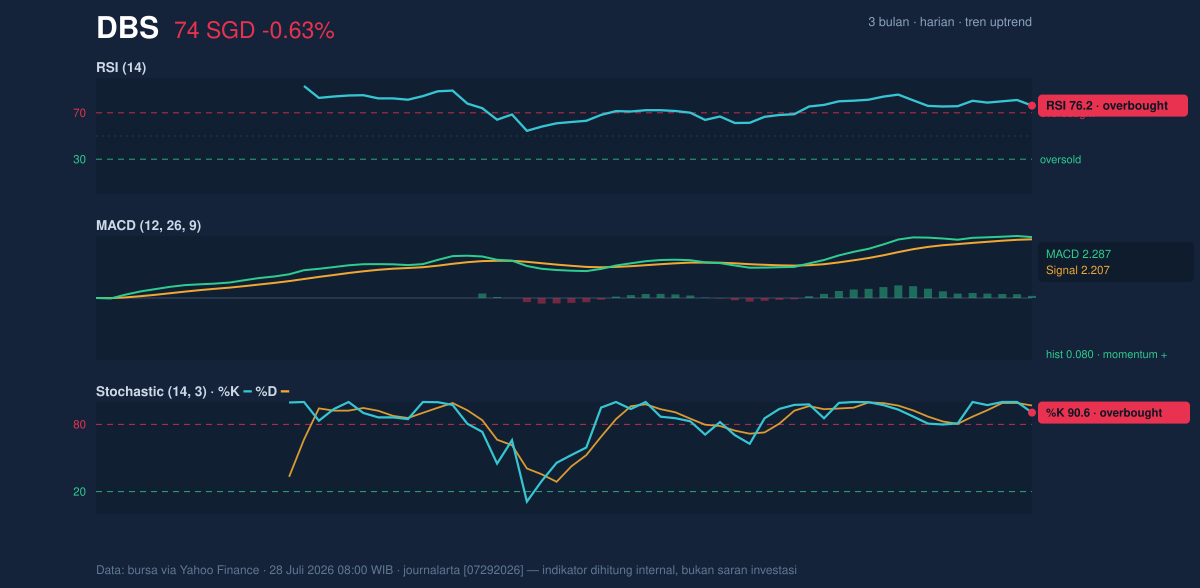
That mix — strong trend, hot oscillators — often produces short bursts of strength followed by digestion rather than immediate reversal.
Volatility & Volume
Volatility is moderate rather than explosive. The ATR(14) of 1.21, equal to 1.6% of price, suggests a normal daily swing range for a large, liquid name like DBS. The Bollinger Band setup is also telling: the upper band sits at SGD 76.32, the middle band at SGD 70.87, and the lower band at SGD 65.43, with %B at 78% and a normal band width of 15.4%. That means the stock is trading in the upper portion of its volatility envelope, but without the kind of band squeeze that usually precedes a violent breakout. The signal here is not panic or euphoria; it is controlled strength.
Volume adds a more nuanced layer. Last trade volume was 5,454,100, about 1.3× the 20-day average of 4,199,327, which shows participation is still healthy. But OBV is down, and that divergence matters. OBV, or on-balance volume, tracks whether volume is flowing in or out over time; a falling OBV while price holds up can suggest that the latest advance is not being broadly confirmed by accumulated buying pressure. Put simply, the market is still active, but not all of that activity is necessarily supportive.
Key Levels & Scenarios
The nearest line in the sand is clear: SGD 74.38. A sustained move through that level would mark a fresh push beyond the current 3-month high and would show that buyers are willing to pay above the recent range high rather than just defend it. On the downside, SGD 70.87 is the first meaningful pivot because it is both the SMA20 and the Bollinger middle band. If that gives way, the market would be signaling that short-term momentum is cooling and price is returning toward the center of its trend structure. Below that, SGD 65.43 is the deeper support that anchors the recent range.
The key point is not simply where DBS is trading, but where it is trading relative to the structure around it. Near the top of the band, the stock is still in control — but control is not the same thing as room to run.
Technical Verdict: HOLD (wait & see)
- Reason 1: The trend remains positive, with price above the SMA20 and SMA50, and the MACD is still above its signal line.
- Reason 2: The stock is stretched, with RSI at 76.2 and Stochastic at 90.6/96.9, which raises the odds of consolidation.
- Reason 3: Volume is supportive at 1.3× average, but OBV is down, so participation is not fully confirming the price push.
- Verdict invalidated if price falls below SGD 70.87, the SMA20 and Bollinger mid-band support.
- Ideal Entry Range: SGD 70.87 to SGD 73.91
- Exit Target: SGD 74.38 to SGD 76.32
- Stop Loss protection: below SGD 65.43
In plain English, DBS still looks strong, but it is already running hot, so the market is waiting to see whether the next move is a clean breakout or just a pause near the top. “It’s a test of conviction now,” one trader could say, “because the stock is asking buyers to prove they still want to pay up.”
Summary Data DBS
| Last price | 73.91 SGD |
| Change 1 day / 5 days / 1 month | -0.63% / 2.65% / 13.01% |
| Trend / MA-cross | uptrend / none |
| SMA20 / SMA50 | 70.87 / 66.67 |
| RSI (14) / Stochastic %K | 76.2 / 90.6 |
| Bollinger %B / ATR | 78% / 1.21 |
| Support / Resistance 20 days | 65.43 / 74.38 |
| Data as of | 28 Juli 2026 08:00 WIB |

