DIS Testing Key Resistance: Stock Gains 2.32% (Juli 29, 2026)
On Juli 29, 2026: price 98.89 USD, trend sideways, RSI 53.7, support 92.83, resistance 99.71. technical analysis of dis stock. DIS Testing Key Resistance —…

Disney’s shares rose to 98.89 on the NYSE, up 2.32% from the previous close of 96.65 as of 28 July 2026, but the move is happening inside a broader sideways pattern rather than a clean trend. The stock is now sitting just under a familiar ceiling: the 20-day resistance at 99.71 and the SMA50 at 99.51, while still above the SMA20 at 96.64. That combination matters because it says the market has improved from short-term weakness, yet has not fully convinced traders that a stronger uptrend is underway. In plain terms, Disney is recovering, but it is still testing whether this is real follow-through or just another bounce inside a range.
Trend & Price Action
As shown in the chart, the price structure is more constructive than it was a few sessions ago, but not decisive. Disney is trading above the SMA20, which usually signals that recent buying has been enough to pull the stock back above its short-term average. At the same time, the SMA20 slope is still negative at -1.08% over 5 days, which means the short-term trend line is still leaning down even though price has popped above it. That mismatch is important: price can outrun its average for a while, but if the average itself is still falling, the market is often in a repair phase rather than a confirmed breakout.
The lack of a fresh MA-cross also keeps the picture mixed. A moving-average cross is often used as shorthand for a trend change; without one, the chart is telling readers not to overread a single strong session. Disney is also trading near the top of its recent band, at 88% of the 20-hour range, which shows buyers have regained control of the latest swing but are now approaching a zone where supply has previously appeared.
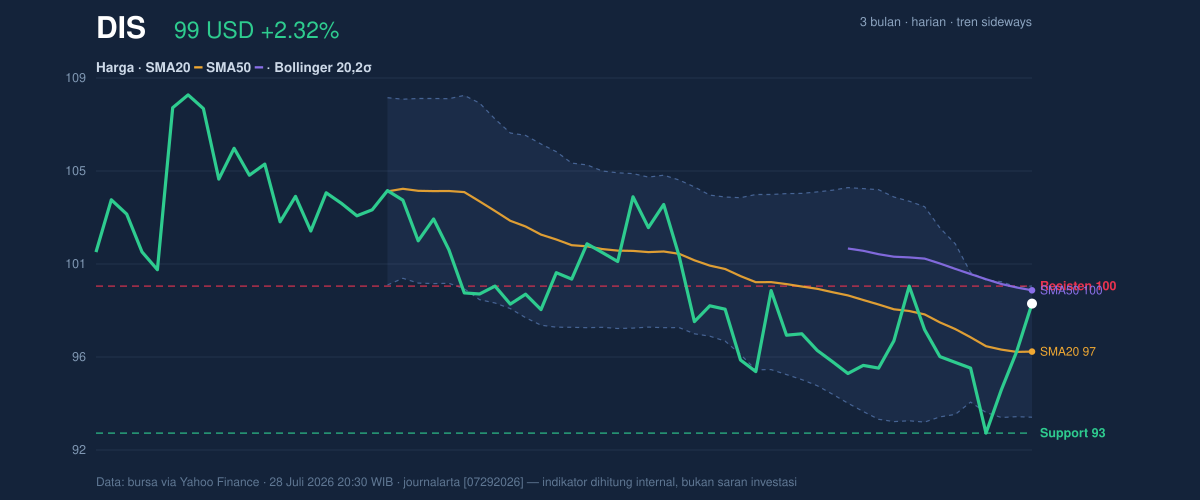
The stock is not far from its 3-month low of 92.49, but it remains well below the 3-month high of 110.48. That wide gap confirms the larger range is still intact.
Oscillators & Momentum
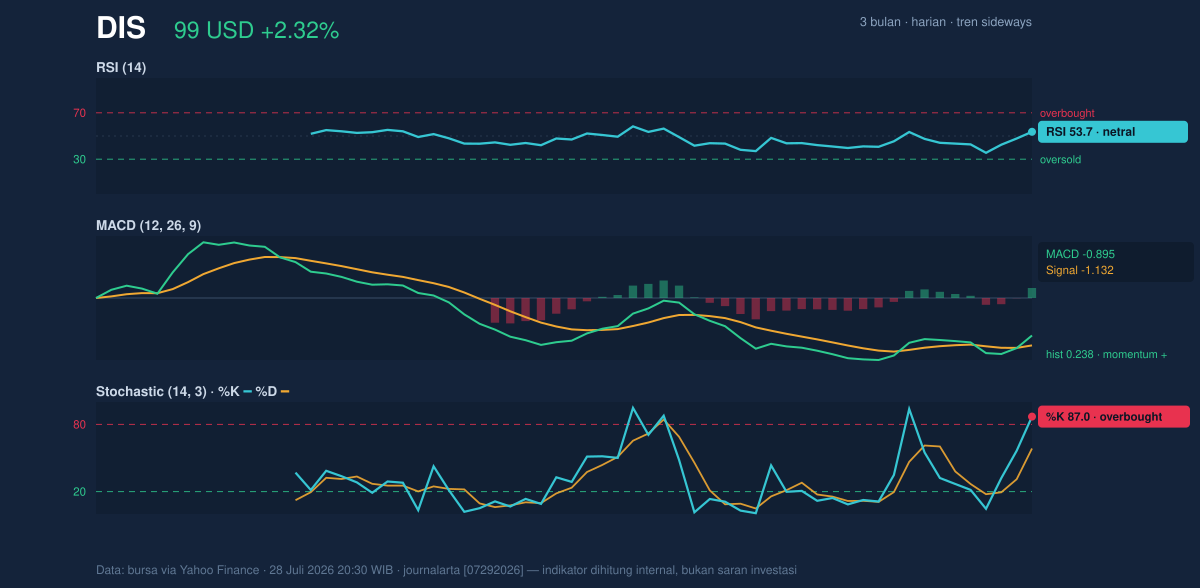
The momentum indicators are more supportive than the trend indicators, but they are not all pointing in the same direction. The RSI at 53.7 is neutral, which usually means the stock is neither overheated nor washed out. That is a healthy reading for a stock trying to build a base: it leaves room for extension without immediately flashing overbought danger. By contrast, the Stochastic %K at 87.0 versus %D at 58.5 is in overbought territory, suggesting the latest push has moved faster than the underlying trend may justify. In simple terms, buyers have been active enough to stretch the short-term oscillator, but that does not guarantee the move can keep running without a pause.
The MACD at -0.895 sits below zero, yet the signal line at -1.132 and histogram at 0.238 show improving momentum. That is a classic “less bad, then better” setup: the stock is still technically below the zero line, which means the longer trend has not fully turned positive, but the histogram above zero says short-term momentum has shifted in favor of buyers. As shown in the chart, this is the kind of setup that can precede a breakout — or simply fade if price cannot clear resistance.
Volatility & Volume
The Bollinger Bands help explain why the next move could matter. With the upper band at 99.72, the middle at 96.64, and the lower at 93.57, Disney is trading close to the upper edge of its recent envelope. The %B at 87% means the price is positioned high within that band, which usually signals strength, but also raises the odds of a pause if buyers hesitate near resistance. More importantly, the 6.4% band width is described as a squeeze, which often means volatility has compressed and the market is storing energy for a larger move. Squeezes do not predict direction; they only warn that the current calm may not last.
Volume adds a useful check. Last volume was 11,389,300, above the 20-day average of 10,406,935, or about 1.1× normal. That is not a dramatic surge, but it does show participation improved as price advanced. The caution is that OBV is falling, and that divergence matters: price can rise on a session-by-session basis even while broader accumulation weakens. When price rises but OBV falls, the market is saying that not all volume is equally committed to the upside.
Key Levels & Scenarios
The most important ceiling is still 99.71, with the SMA50 at 99.51 sitting almost on top of it. That overlap makes the area especially meaningful because it combines a technical average with a recent resistance level. If Disney can clear that zone, the chart would begin to look less like a range and more like an attempt to reclaim the upper half of its broader band. On the downside, the first important floor is the SMA20 at 96.64, followed by the 20-hour support at 92.83. A failure back below the shorter average would weaken the current rebound; a break of the lower support would suggest the latest bounce has lost its footing.
The key signal is simple: Disney is pressing into resistance with improving momentum, but the trend is not yet fully confirmed.
Technical Verdict: HOLD (wait & see)
HOLD (wait & see)
- MACD is improving and the histogram is positive, which supports the idea that short-term momentum has turned upward.
- RSI is neutral at 53.7, so the stock is not overextended, but Stochastic is overbought at 87.0, warning that the move is stretched near resistance.
- Price is above the SMA20, yet the SMA20 slope remains negative and there is no fresh MA-cross, so the trend is not fully confirmed.
Verdict invalidated if price breaks below 96.64, because that would put Disney back under the short-term average and weaken the current recovery.
- Ideal Entry Range: 96.64 to 99.51
- Exit Target: 99.71, then 110.48 if resistance is reclaimed
- Stop Loss protection: 92.83
For non-traders, this means Disney’s chart is improving, but it still needs to prove that the recent bounce can survive the first real test at resistance.
“The market is asking Disney to prove it can stay above 99.71, not just touch it.”
Summary Data DIS
| Last price | 98.89 USD |
| Change 1 day / 5 days / 1 month | 2.32% / 2.86% / 0.26% |
| Trend / MA-cross | sideways / none |
| SMA20 / SMA50 | 96.64 / 99.51 |
| RSI (14) / Stochastic %K | 53.7 / 87.0 |
| Bollinger %B / ATR | 87% / 2.23 |
| Support / Resistance 20 days | 92.83 / 99.71 |
| Data as of | 28 Juli 2026 20:30 WIB |



