Momentum Weakens, UOB Stock Drops 0.83% Today
On Juli 29, 2026: price 43.14 SGD, trend uptrend, RSI 60.3, support 39.65, resistance 44.95. technical analysis of uob stock. Momentum Weakens — full details…

United Overseas Bank (UOB) traded at SGD 43.14 on SGX in Singapore, slipping 0.83% from the previous close even as the broader technical setup still points to an established uptrend. The stock is holding above its short- and medium-term moving averages, but the latest session also shows a small loss of momentum: price is still above the trend line, yet the MACD has turned negative, which means the pace of the advance has cooled even though the trend itself has not broken.
Trend & Price Action
The clearest signal in the chart is that UOB remains in an upward structure. Price is above SMA20 at SGD 42.74 and well above SMA50 at SGD 40.26, a configuration that usually tells market participants the stock is still trading in a constructive trend rather than in a corrective phase. The SMA20 slope of 2.00% over 5 days also matters: it shows the near-term trend is still rising, so recent softness has not yet reversed the broader direction.
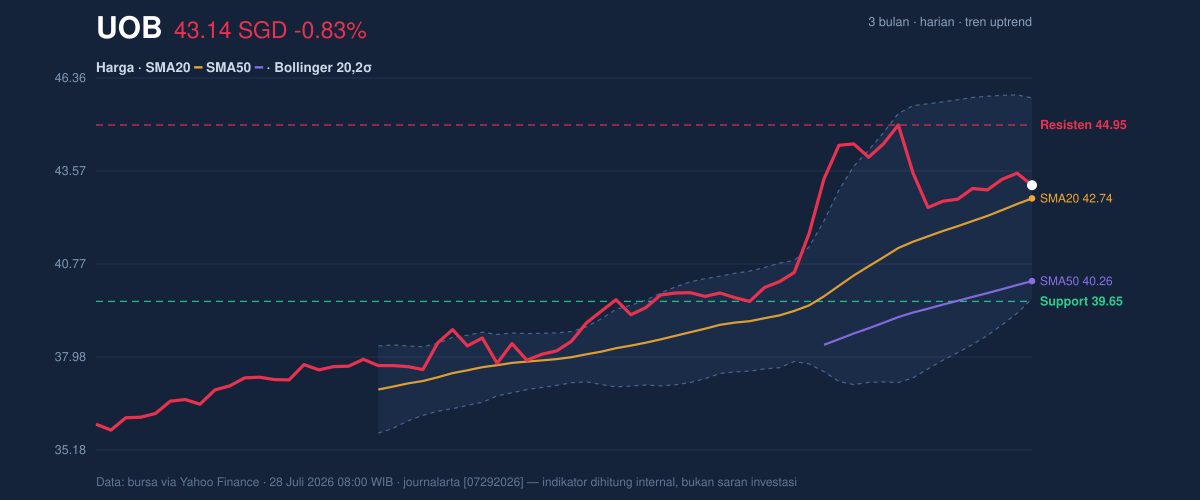
The stock is also sitting in the upper part of its recent trading band, at about 66% of the 20-hour range, with support at SGD 39.65 and resistance at SGD 44.95. That positioning suggests buyers have so far defended the lower end of the range, but the market has not yet forced a breakout through the ceiling. In plain language, UOB is closer to the top of its corridor than the bottom, which usually leaves less room for easy upward extension unless fresh demand appears.
The broader range gives that picture more context. UOB’s 3-month high is SGD 45.15 and the 3-month low is SGD 35.74, so the current price is trading near the upper half of its recent three-month span. That is a sign of relative strength, but also a reminder that the next move matters: a push through the upper band would confirm continuation, while repeated failure near resistance would hint at fatigue.
Oscillators & Momentum
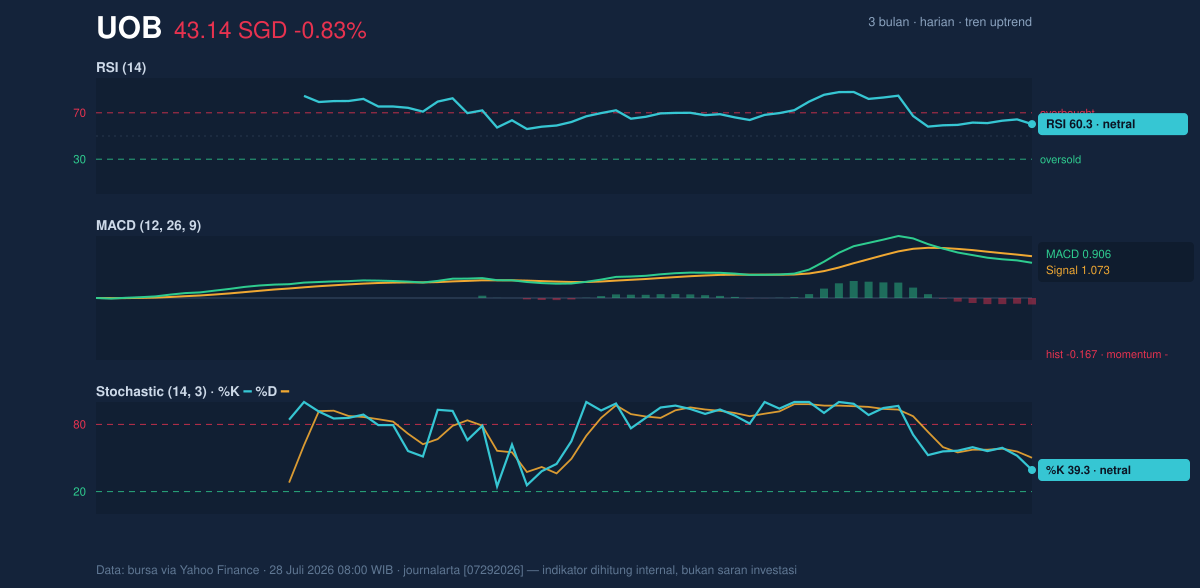
Momentum indicators are mixed rather than fully aligned. The RSI at 60.3 is neutral-to-firm, which means the stock is not overbought and still has room to advance, but it is no longer in the early stage of a rebound. The Stochastic %K at 39.3 and %D at 50.2 are also neutral, showing the stock is neither stretched nor washed out. Taken together, these oscillators do not argue for panic or euphoria; they suggest consolidation within an uptrend.
The more important warning comes from MACD. The MACD at 0.906 remains above zero, which keeps the longer trend constructive, but it is below the signal line at 1.073 and the histogram at -0.167 is negative. That combination usually means upside momentum has weakened relative to the recent pace. In practical terms, the trend is still alive, but the engine is not accelerating. If price can recover while MACD turns back up, the chart would look healthier; if not, the stock may need time to digest gains.
Volatility & Volume
Volatility is moderate, not explosive. The ATR(14) at 0.91, equal to 2.1% of price, indicates that daily swings are present but not extreme. That matters because it suggests any move through resistance or support could develop in a measured way rather than in a sudden gap-like break. The Bollinger Bands reinforce that reading: price is above the middle band at SGD 42.74, with the upper band at SGD 45.76 and the lower band at SGD 39.73. The %B at 57% shows price is slightly above the midpoint of the band structure, while the 14.1% band width points to normal, not compressed, volatility.
That combination is important. A normal-width Bollinger structure usually means the market is not sitting in a squeeze that is primed for an abrupt expansion. Instead, it suggests UOB is already in a functioning trend channel, and the next meaningful move will likely depend on whether buyers can absorb supply near resistance. Volume was lighter than usual, with 3,022,532 shares traded versus a 20-hour average of 3,534,738, or about 0.9x normal. Lower participation on a down day can soften the bearish message, but it also means the market has not yet shown strong conviction. The upward-sloping OBV is the better sign here, because it implies net accumulation has still been building beneath the surface even if the latest session was quieter.
Key Levels & Scenarios
The immediate technical map is straightforward. SGD 44.95 is the first resistance to watch, and SGD 45.15 is the more important nearby ceiling from the three-month range. A move through that zone would suggest the stock is escaping the upper edge of its recent trading range, especially if volume improves. On the downside, SGD 42.74 is the first support because it is the 20-day average and the Bollinger middle band, while SGD 39.73 and SGD 39.65 form the lower technical floor from the band and range support.
If UOB holds above SGD 42.74 and reclaims SGD 44.95, the chart would look more like a continuation pattern than a topping attempt. If it loses SGD 42.74, the market would be signaling that the short-term trend is weakening; a fall toward SGD 39.73/SGD 39.65 would then become the key test of whether the broader uptrend still has depth.
Technical Verdict: HOLD (wait & see)
HOLD (wait & see)
- Reason 1: Price remains above SMA20 at SGD 42.74 and SMA50 at SGD 40.26, so the broader trend is still positive.
- Reason 2: MACD is negative versus its signal line and the histogram is -0.167, showing momentum has faded even though trend structure is intact.
- Reason 3: RSI at 60.3 and Stochastic at 39.3/50.2 are neutral, which does not yet confirm a fresh breakout or a deeper reversal.
- Verdict invalidated if price breaks below SGD 42.74, because that would mean the stock has lost the nearest trend support.
- Ideal Entry Range: SGD 42.74 to SGD 43.14
- Exit Target (Target Price): SGD 44.95 to SGD 45.15
- Stop Loss protection: Below SGD 39.73, with SGD 39.65 as the nearby support reference
For non-traders: UOB still looks technically healthy, but the chart is asking for proof that the recent upward trend can resume before the next leg higher.
Summary Data UOB
| Last price | 43.14 SGD |
| Change 1 day / 5 days / 1 month | -0.83% / 0.98% / 8.50% |
| Trend / MA-cross | uptrend / none |
| SMA20 / SMA50 | 42.74 / 40.26 |
| RSI (14) / Stochastic %K | 60.3 / 39.3 |
| Bollinger %B / ATR | 57% / 0.91 |
| Support / Resistance 20 days | 39.65 / 44.95 |
| Data as of | 28 Juli 2026 08:00 WIB |

