OCBC Stock Drops 0.55% Today, RSI Overbought
On Juli 29, 2026: price 28.93 SGD, trend uptrend, RSI 80.7, support 24.66, resistance 29.29. technical analysis of ocbc stock. OCBC Stock Drops — full details…

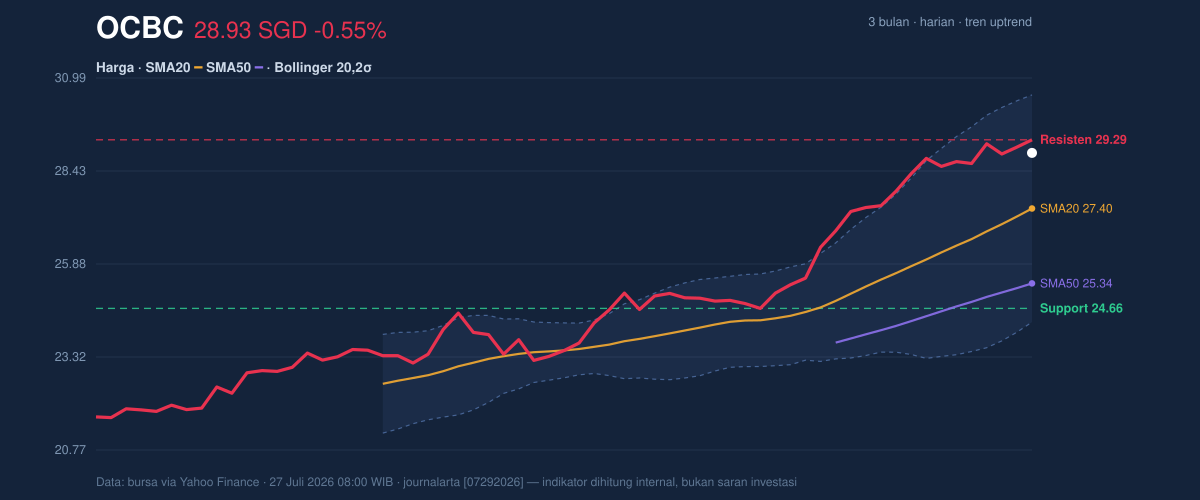
OCBC Bank slipped 1 day -0.55% to SGD 28.93 in the latest SGX-linked data, but the softer close sits inside a much stronger short-term advance: the stock is still up 1 month 16.28% and remains in an uptrend, with the price above SMA20 at 27.40 and well above SMA50 at 25.34. As shown in the chart, that positioning matters because it says the recent pullback has not yet broken the broader trend; instead, the stock is trading near the top of its recent range, just under the 20-hour resistance at 29.29 and within reach of the 3-month high at 29.30.
Trend & Price Action
The trend structure is still constructive, but it is also getting stretched. The SMA20 is rising 3.87% over 5 days, which signals that short-term buyers have been willing to pay up at increasingly higher levels. That is usually a sign of momentum-led accumulation rather than a slow, grinding drift. The absence of a fresh MA-cross means this move is not being driven by a new medium-term crossover event; instead, it is being sustained by the existing alignment of the moving averages, with price holding above both the 20-day and 50-day averages.
The location inside the range is just as important as the trend itself. At 92% of the 20-hour range, OCBC is trading close to the upper boundary rather than the middle, which suggests the market is still pricing in strength. But being this close to the ceiling also means there is less room for a clean extension before traders start taking profits. The nearby 29.29 resistance and 29.30 three-month high create a clear test: a move through that area would confirm that the stock is not merely consolidating near highs, but attempting to establish a fresh leg higher.
Oscillators & Momentum
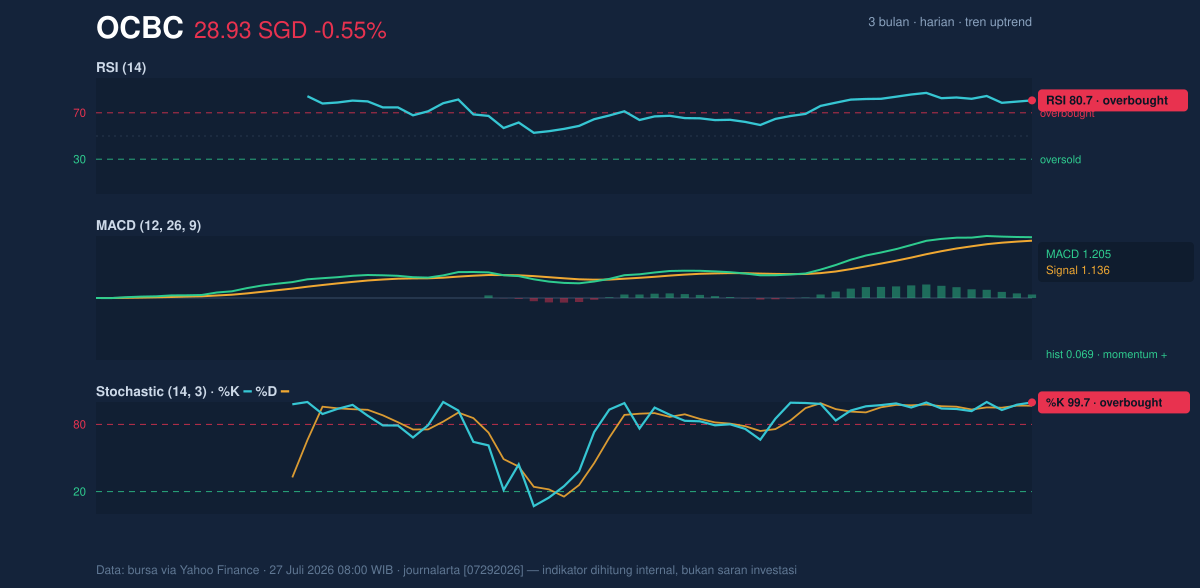
As shown in the chart, the momentum signals are the main caution flag. RSI at 80.7 and Stochastic %K at 99.7 / %D at 96.7 both sit in overbought territory, which does not mean an immediate reversal is guaranteed, but it does mean the stock is statistically extended relative to recent trading. In plain language, the move has been strong enough that the market may need either a pause or a shallow pullback to cool off before it can sustain another push.
That said, the momentum picture is not bearish. MACD at 1.205 remains above its signal line at 1.136, with a positive histogram of 0.069. This tells us upward momentum is still intact even as oscillators flash overheating. When MACD stays positive while RSI and Stochastic are stretched, it often means trend-following buyers are still in control, but the stock is vulnerable to sharper intraday swings if profit-taking starts. The combination is more consistent with a strong trend nearing a near-term pause than with an outright trend failure.
Volatility & Volume
Volatility is elevated but not chaotic. The Bollinger Bands are widening, with a band width of 22.8%, which indicates the stock has entered a more active trading phase. Wide bands usually accompany stronger directional movement, but they also warn that price can travel farther in either direction than it could during a quiet range. The %B at 74% shows price is leaning toward the upper band at 30.52, reinforcing the idea that the stock is extended on the upside without yet being over the band.
ATR at 0.59, equal to 2.1% of price, points to moderate day-to-day movement in absolute terms. That is important because it tempers the overbought readings: the stock is not in a disorderly volatility spike, but it is moving enough that short-term reversals can look abrupt. Volume adds another layer. The latest turnover of 4,376,590 is only 0.7x normal versus the 20-hour average of 6,257,847, which means the latest price action was not backed by unusually heavy participation. In other words, the advance has been supported by a rising trend and positive OBV, but the most recent session did not show a decisive surge in conviction.
Key Levels & Scenarios
The immediate map is straightforward. Support at 24.66 marks the lower edge of the recent 20-hour range, while resistance at 29.29 is the first obvious ceiling. The stock’s position near the top of that range means the market is effectively testing whether buyers can keep defending gains after a strong monthly run. If price clears 29.29 and holds above the 3-month high of 29.30, the chart would show a clean breakout from the current congestion near highs. If it fails there, the more likely result is a fade back toward the rising mid-band area around SMA20 at 27.40, where trend support has been forming.
The Bollinger framework adds a second layer: the middle band at 27.40 is also the 20-day average, so any retreat toward that level would not automatically damage the trend; it would simply mean the stock is reverting from an overextended condition back to its mean. A deeper loss of 24.66 would be more meaningful because it would break the lower end of the current range and challenge the idea that the latest leg higher remains intact.
Technical Verdict: HOLD (wait & see)
HOLD (wait & see) fits the chart best because the trend is still positive, but momentum is stretched and the latest volume did not confirm a fresh breakout. RSI at 80.7 and Stochastic at 99.7/96.7 warn that the stock is overbought, while MACD remains positive and price stays above SMA20, so the broader structure is not broken. The widening Bollinger Bands suggest the move is active, but the stock is already near 29.29/29.30 resistance, where follow-through matters most.
- Ideal Entry Range: around 27.40 to 24.66, where the SMA20 and range support can be assessed for stability.
- Exit Target: 29.29 to 30.52, based on the current resistance and the upper Bollinger Band.
- Stop Loss protection: below 24.66, which would invalidate the current range support and weaken the uptrend structure.
For non-traders: the chart still points up, but the stock is stretched near resistance, so the next move matters more than the last one.
The next technical test is whether OCBC can hold above 29.29 and then 29.30, or whether the overbought signals pull it back toward 27.40.
Summary Data OCBC
| Last price | 28.93 SGD |
| Change 1 day / 5 days / 1 month | -0.55% / 0.84% / 16.28% |
| Trend / MA-cross | uptrend / none |
| SMA20 / SMA50 | 27.40 / 25.34 |
| RSI (14) / Stochastic %K | 80.7 / 99.7 |
| Bollinger %B / ATR | 74% / 0.59 |
| Support / Resistance 20 days | 24.66 / 29.29 |
| Data as of | 27 Juli 2026 08:00 WIB |


