Shell Stock Analysis: Drops 2.15%, Momentum Gains
On Juli 29, 2026: price 3,234.50 GBp, trend sideways, RSI 62.8, support 2,872.50, resistance 3,344.00. technical analysis of shell stock.

Shell plc edged lower on the LSE in London on 27 July 2026, with the shares last changing hands at 3,234.50 GBp, down 2.15% on the day after a 3,305.50 previous close. The move leaves the stock above its short- and medium-term averages, but still inside a sideways pattern, which matters because it suggests the market is not rejecting the uptrend — it is pausing near the upper half of its recent range while traders test whether the latest advance has enough follow-through.
Trend & Price Action
As shown in the chart, Shell is trading above both the SMA20 at 3,107.63 and the SMA50 at 3,122.34, a constructive sign because price holding above these averages usually means recent buyers still have the upper hand. The absence of a fresh MA-cross also matters: there is no new crossover to confirm a stronger trend shift, so the structure remains more of a steady climb than a breakout regime.
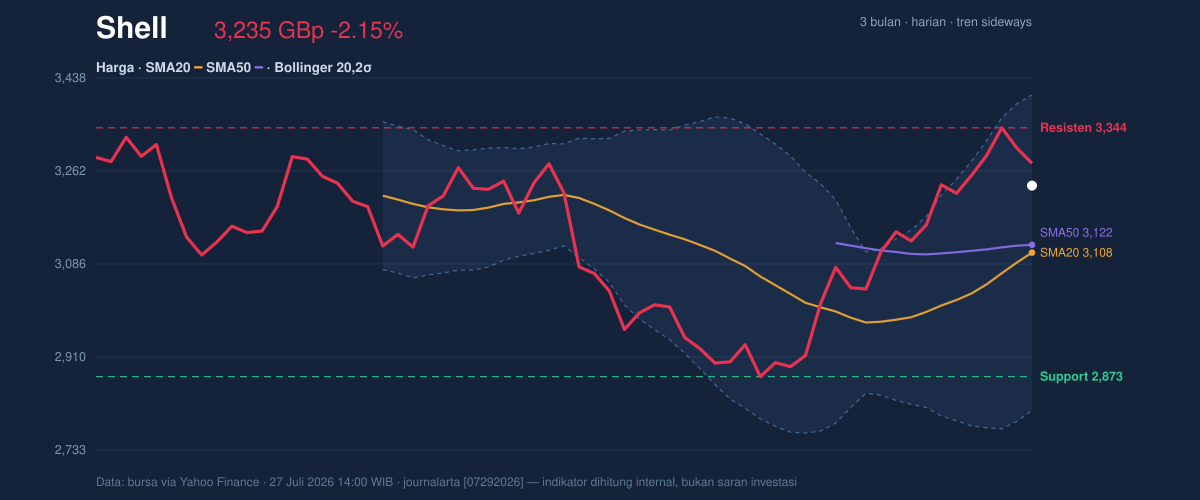
The stock is described as sideways, yet the SMA20 slope of 2.98% over 5 days shows the shorter trend is still leaning upward. That combination often signals a market in consolidation rather than deterioration. In plain English, Shell is not breaking down; it is digesting gains after a strong one-month move of 11.52%. The fact that the share price sits at 77% of its 20-hour range reinforces that point: it is closer to the top of the recent band than the bottom, which usually reflects resilience even when the daily tape softens.
The broader range adds context. Shell remains well below the 3-month high of 3,758.50, but far above the 3-month low of 2,559.50, showing the recovery has room left before it retests the prior peak. That distance is important because it suggests the market is still in the middle of a rebuilding phase rather than at an exhausted extreme.
Oscillators & Momentum
The momentum picture is more mixed, and that is where the chart becomes useful. The RSI at 62.8 is neutral-to-firm, meaning the stock has positive momentum without yet entering a classic overbought warning zone. By contrast, the Stochastic %K at 89.7 and %D at 93.7 are both overbought, which signals the recent advance has moved quickly and may need cooling. That does not automatically mean a reversal; it often means the stock is stretched in the short term and vulnerable to pauses or pullbacks if new buyers hesitate.
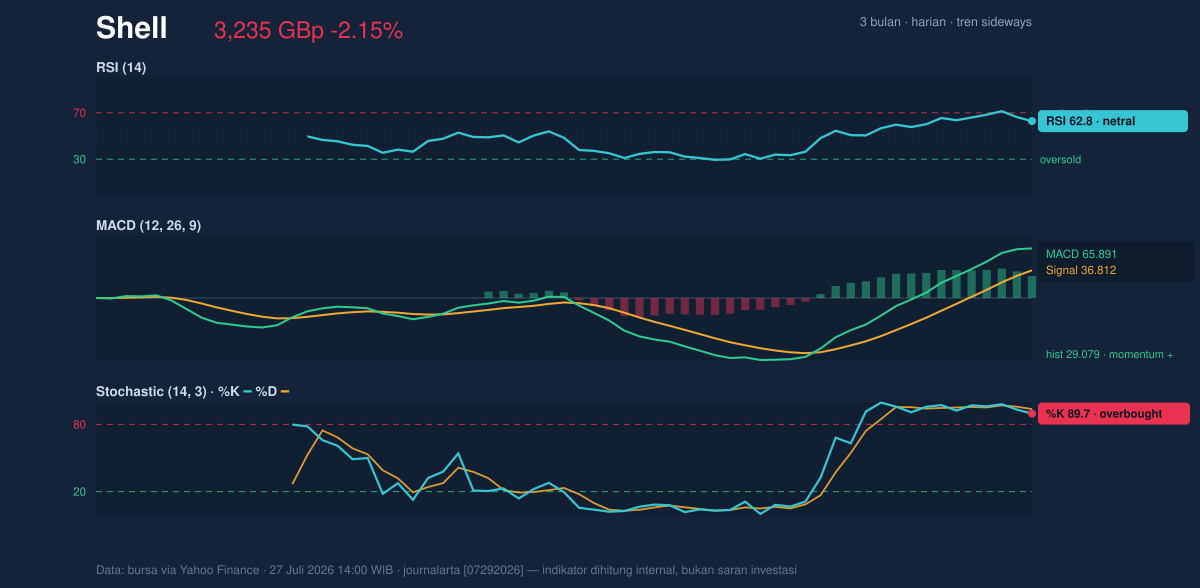
The MACD at 65.891, above its signal line at 36.812 with a histogram of 29.079, is the clearest confirmation that trend momentum remains positive. In practical terms, MACD is measuring whether the recent price trend is strengthening relative to its own recent average, and here it says yes. The tension between a positive MACD and overbought stochastic readings is telling: Shell still has underlying momentum, but the short-term pace is running ahead of itself. That often produces choppy trading rather than a clean directional sprint.
Volatility & Volume
Volatility is not subdued. The ATR(14) of 130.21, equal to 4.0% of price, indicates a relatively wide daily swing environment, which means the shares can move sharply even without a major change in fundamentals. The Bollinger Bands reinforce that message. With the upper band at 3,406.44, the middle at 3,107.63, and the lower at 2,808.81, price is trading above the midline and below the upper band, while %B at 71% shows it is leaning toward the upper half of the envelope but not pressing the ceiling. The 19.2% band width is described as normal, so this is not a squeeze that usually precedes an explosive break; instead, it points to an orderly market with enough room for movement in either direction.
Volume tempers the bullish case. Last volume was 5,542,646, only 0.6x the 20-hour average of 8,574,150. That means the latest dip or advance was not powered by strong participation, which can make price action less trustworthy. Still, OBV is rising, and that is important because on-balance volume tracks whether money flow is accumulating over time. Rising OBV alongside price above the moving averages suggests the broader crowd has not abandoned the stock, even if the latest session was quieter than usual.
Key Levels & Scenarios
The nearest reference points are clear. Support at 2,872.50 is the level that matters if the current consolidation deepens, while resistance at 3,344.00 is the first obvious ceiling the market must clear to extend the move. The upper Bollinger band at 3,406.44 sits just above that resistance, so a clean push through the band would likely signal that the recent advance is regaining traction. On the downside, the Bollinger middle line at 3,107.63 and the SMA50 at 3,122.34 form a nearby support cluster; losing that cluster would weaken the short-term structure even if the broader trend has not fully rolled over.
If Shell holds above the 3,107.63-3,122.34 zone, the chart suggests the market is still consolidating within an upward bias. If it fails to hold that area, the next test becomes whether buyers defend 2,872.50, because that level would decide whether the move is simply pausing or starting to unwind.
Technical Verdict: HOLD (wait & see)
HOLD (wait & see) fits the current setup because the trend is constructive, but the short-term momentum is stretched and volume is below average.
- Reason 1: MACD remains positive, with the line above the signal and a positive histogram, which confirms underlying momentum.
- Reason 2: Price is above the SMA20 and SMA50, so the medium-term structure is still intact.
- Reason 3: Stochastic is overbought and volume is only 0.6x normal, which warns that the latest push may need confirmation.
- Verdict invalidated if price falls below 3,107.63, because that would break the Bollinger midline and the SMA20/SMA50 support cluster.
- Ideal Entry Range: 3,107.63 to 3,122.34
- Exit Target: 3,344.00 to 3,406.44
- Stop Loss protection: 2,872.50
For non-traders, this means Shell still looks technically firm, but the latest move is not strong enough to call a clean breakout yet.
“The stock is still holding its structure, but the market has not yet proved it can push through resistance with conviction.”
Summary Data Shell
| Last price | 3,234.50 GBp |
| Change 1 day / 5 days / 1 month | -2.15% / 0.45% / 11.52% |
| Trend / MA-cross | sideways / none |
| SMA20 / SMA50 | 3,107.63 / 3,122.34 |
| RSI (14) / Stochastic %K | 62.8 / 89.7 |
| Bollinger %B / ATR | 71% / 130.21 |
| Support / Resistance 20 days | 2,872.50 / 3,344.00 |
| Data as of | 27 Juli 2026 14:00 WIB |



