AIA Stock Gains 0.26%, Testing Key Resistance In Focus
On Juli 30, 2026: price 78.15 HKD, trend sideways, RSI 59.0, support 71.45, resistance 78.60. technical analysis of aia stock. AIA Stock Gains — full details…

AIA Group’s shares were last quoted at HKD 78.15, up 0.26% on the day and 8.24% over one month, but the tape is now pressing against near-term resistance rather than building a fresh breakout. As shown in the chart, the stock is trading above both SMA20 at HKD 74.96 and SMA50 at HKD 76.87, which keeps the broader short-term structure constructive. Yet the move has matured: price sits at 94% of the 20-hour range, just under resistance at HKD 78.60, while the upper Bollinger band at HKD 79.43 marks the next technical ceiling.
Trend & Price Action
The message from trend-following tools is straightforward: AIA is still in a sideways phase, but it is leaning upward inside that range. The SMA20 slope of 1.88% over 5 days tells readers the short-term average is rising, which usually means recent buying has been strong enough to lift the base of the chart. Price holding above the SMA20 and SMA50 is important because those levels often act as dynamic support, not fixed price floors.
What matters more now is where the stock is trading within its recent band. At HKD 78.15, AIA is close to the top of the HKD 71.45 to HKD 78.60 20-hour range, so the market is no longer pricing in a bargain; it is testing whether buyers still have conviction after a month-long climb. The 3-month range adds context: the stock remains well below the HKD 89.95 high, but comfortably above the HKD 69.05 low. That is a sign of recovery, not a trend already in full breakout mode.
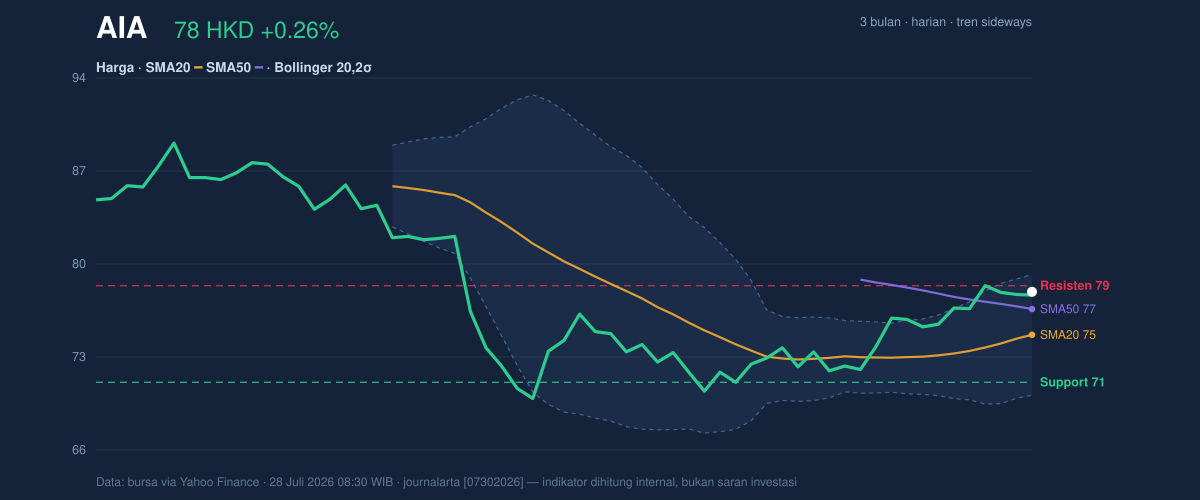
The chart also shows why the current setup is delicate. The price is near the upper Bollinger band, which often signals an extended move rather than an immediate reversal, but it also means upside is becoming more difficult to sustain without fresh participation. With no new MA crossover, the trend is being carried by price position and slope rather than a stronger moving-average signal.
Oscillators & Momentum
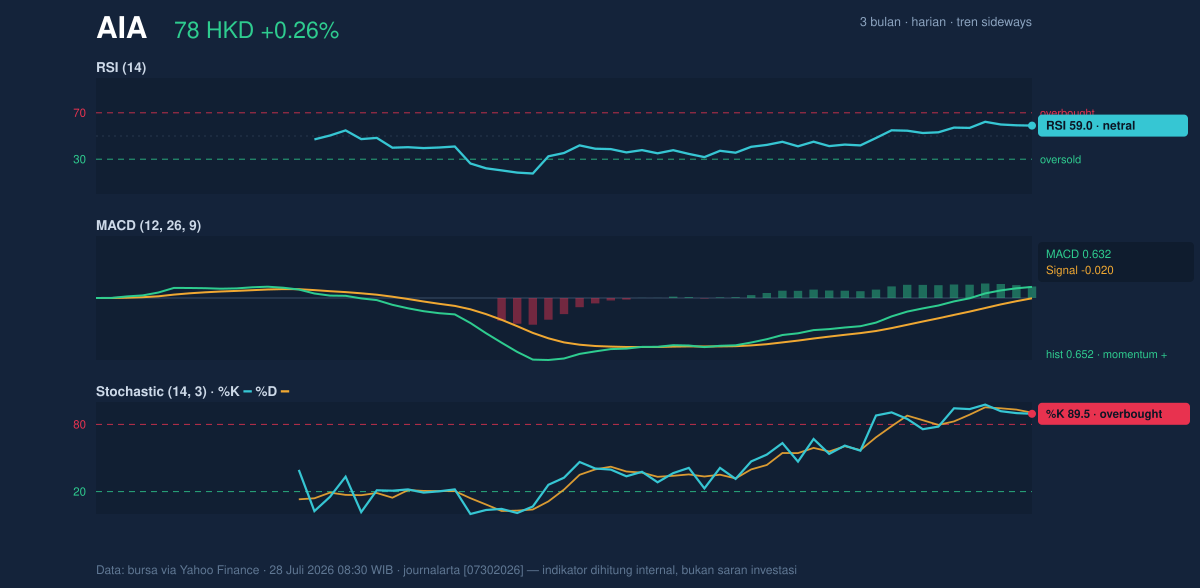
Momentum is mixed, and that mix is the key to reading this name correctly. The RSI at 59.0 is neutral, which means the stock is not yet in a classic overbought condition on that measure. But the Stochastic %K at 89.5 and %D at 90.4 are both overbought, showing the recent advance has moved fast enough that short-term momentum is stretched. In plain language, the stock has been climbing, but it may need to pause before it can climb further.
That tension is reinforced by the MACD. The MACD at 0.632, above the signal line at -0.020, with a histogram of 0.652, indicates positive momentum is still in force. The histogram matters because it shows the gap between the MACD line and its signal line; when it is positive and wide, the market is still leaning bullish. So the oscillator picture is not bearish. It is simply less comfortable for fresh upside than the price chart alone might suggest.
The combination is telling: RSI is not yet flashing a warning, MACD is still supportive, but Stochastic is stretched. That usually means the trend is intact, while timing risk is rising. Momentum is confirming the move, yet it is also warning that the stock is nearer to a short-term pause than the start of a new impulsive leg.
Volatility & Volume
Volatility is moderate rather than explosive. The ATR at 1.97, or 2.5% of price, suggests the stock can move meaningfully in a session, but not in a disorderly way. The Bollinger band width of 11.9% is described as normal, so there is no squeeze implying an imminent volatility burst, nor a wide expansion suggesting panic or euphoria. That matters because a normal band width combined with price near the upper band often points to a market that is already extended but not yet unstable.
Volume, however, is not confirming enthusiasm. Last volume was 19,122,920, below the 20-hour average of 23,937,259, or 0.8x normal. That means the latest rise is happening on lighter participation than usual. In technical analysis, rising price with softer volume is not a collapse signal, but it does weaken the quality of the move. The OBV is falling, which is more concerning because on-balance volume tracks whether money is broadly flowing into the stock. A falling OBV while price is near resistance suggests the advance has not yet won broad conviction.
Key Levels & Scenarios
The market is now defined by a tight set of levels. Immediate support sits at HKD 74.96, which is also the SMA20 and the Bollinger middle band. That overlap makes it a meaningful pivot: if price slips back there, the chart would be testing whether recent gains were durable or merely a short-term overshoot. Below that, HKD 71.45 is the next support from the 20-hour range.
On the upside, HKD 78.60 is the first resistance to watch, with the upper Bollinger band at HKD 79.43 just above it. A clean move through that zone would suggest the stock is escaping the current ceiling and forcing the range higher. But because volume is light and OBV is falling, any move above resistance would need stronger participation to be treated as credible rather than temporary.
Technical Verdict: HOLD (wait & see)
HOLD (wait & see)
- Price is above SMA20 and SMA50, which keeps the short-term trend constructive.
- MACD remains positive, but Stochastic is overbought, so momentum is supportive yet stretched.
- Volume is 0.8x normal and OBV is falling, which weakens confirmation near resistance.
Verdict invalidated if price breaks below HKD 74.96.
- Ideal Entry Range: HKD 74.96 to HKD 76.87
- Exit Target: HKD 78.60 to HKD 79.43
- Stop Loss protection: below HKD 71.45
In plain English: the chart still leans positive, but the stock is close enough to resistance that the next move needs proof, not just momentum.
Summary Data AIA
| Last price | 78.15 HKD |
| Change 1 day / 5 days / 1 month | 0.26% / 1.56% / 8.24% |
| Trend / MA-cross | sideways / none |
| SMA20 / SMA50 | 74.96 / 76.87 |
| RSI (14) / Stochastic %K | 59.0 / 89.5 |
| Bollinger %B / ATR | 86% / 1.97 |
| Support / Resistance 20 days | 71.45 / 78.60 |
| Data as of | 28 Juli 2026 08:30 WIB |



