Alibaba Stock Gains 2.34% Today, Momentum Gains
On Juli 30, 2026: price 113.60 HKD, trend sideways, RSI 52.5, support 92.85, resistance 117.00. technical analysis of alibaba stock. Alibaba Stock Gains — full…

Alibaba Group’s Hong Kong-listed shares rose to HKD 113.60 in Tuesday trade, up 2.34% from the previous close, but the move still leaves the stock in a broader sideways pattern, according to data from Yahoo Finance via the Hong Kong exchange. The key signal is not just the gain itself: Alibaba is trading above its 20-day moving average at HKD 107.93 and just above its 50-day moving average at HKD 112.71, which tells traders the share price has recovered enough to sit back inside its short-term trend band, even if it has not yet broken into a cleaner uptrend. The stock is also sitting at 86% of its 20-day range, close enough to resistance to show strength, but not so stretched that momentum looks exhausted. That balance matters.
Trend & Price Action
The chart shows a stock that has rebuilt some ground after a weaker five-day patch, with 5-day performance at -2.91% but 1-month performance at 22.15%. That combination usually means the market has not rejected the move higher; rather, it has paused after a sharp monthly run. The longer-term structure is still described as sideways, and the SMA20 slope of 4.13% over five days suggests the short-term trend is tilting upward, even if the absence of a fresh MA-cross means the chart is not giving a decisive trend-break signal yet.
What stands out is positioning. Alibaba is above the SMA20, which often acts like the first line of trend support, but it is only slightly above the SMA50. That narrow gap tells the market is testing whether the recent rebound can turn into something more durable. In plain terms: the shares are no longer weak, but they still need confirmation.
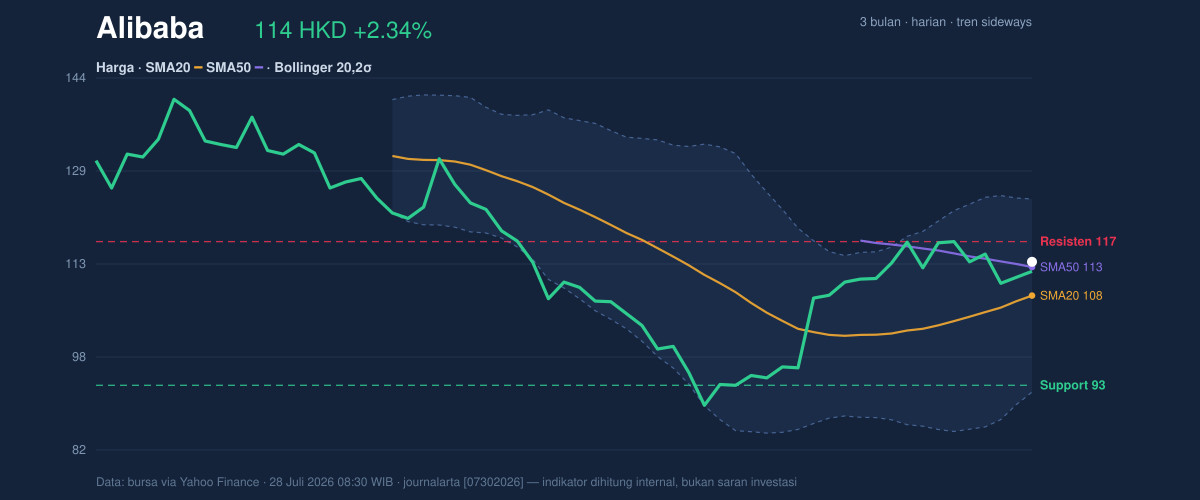
The nearest technical ceiling is the HKD 117.00 resistance. If the stock can clear that level, the chart would likely shift from recovery mode to a more convincing breakout attempt. If it fails there, the move may remain trapped inside the range.
Oscillators & Momentum
Momentum indicators are mixed, which is exactly what you would expect when a stock sits near the middle-upper part of a trading band rather than in a clean trend. The RSI at 52.5 is neutral, meaning Alibaba is neither overbought nor oversold. That matters because it leaves room for further upside without immediately warning of overheating. The Stochastic %K at 35.7 and %D at 50.7 is also neutral, but the gap between the two lines suggests short-term momentum is still rebuilding rather than accelerating aggressively.
The more constructive signal is in MACD. With MACD at 1.148 above its signal line at 0.412 and a positive histogram of 0.736, the trend impulse is still positive. MACD measures whether price momentum is improving or fading; when the main line sits above the signal line and the histogram is positive, it usually means buyers still have some control, even if they are not in a rush. That fits the broader picture: not a breakout, not a breakdown, but a market with a positive undertone.
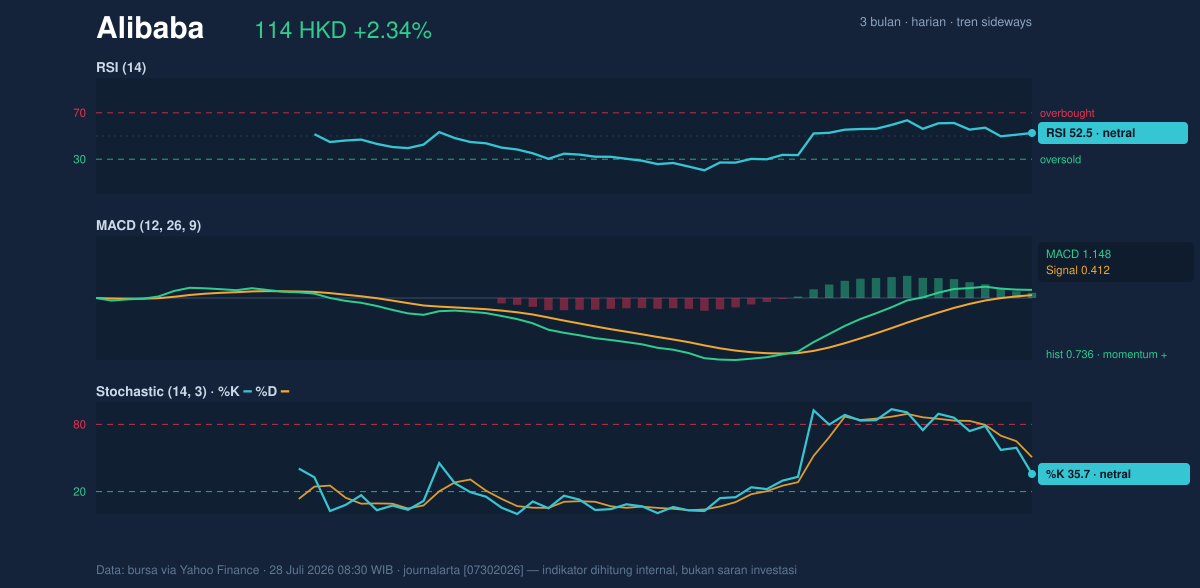
The signal is constructive, but not strong enough to call it a full momentum surge.
Volatility & Volume
Volatility is elevated. The Bollinger Band data shows the upper band at HKD 124.15, the middle band at HKD 107.93, and the lower band at HKD 91.71, with a 30.1% band width that is described as widening. A widening Bollinger setup usually means the stock has moved out of a quiet phase and into a more active one, so traders should expect larger swings in both directions. The current %B of 67% says the price is above the middle of the band but still below the upper edge, which is consistent with a stock that has room to extend without immediately looking overbought.
The ATR(14) at 5.26, equal to 4.6% of price, reinforces that point. ATR is a measure of average daily movement; a higher reading means wider day-to-day swings. For Alibaba, this means the stock can travel quickly once it chooses direction.
Volume is less supportive than the price action. The latest turnover of 75,913,853 shares is only 0.7x normal versus the 20-session average of 112,664,084. That matters because breakouts usually need strong participation. Still, OBV is rising, which implies the balance of accumulation remains positive even though the latest session did not come with full-volume confirmation. In other words, the market is leaning constructive, but not loudly.
Key Levels & Scenarios
The immediate support is HKD 92.85, while the first resistance is HKD 117.00. Those levels frame the current trade. With the share price at HKD 113.60, Alibaba is closer to resistance than support, which suggests the market is testing the upper part of its recent range rather than drifting aimlessly in the middle. The broader 3-month range adds context: HKD 144.00 as the high and HKD 88.65 as the low. That places the current price well above the lower end of the range, but still meaningfully below the peak, which is typical of a stock trying to rebuild trend credibility.
If HKD 117.00 gives way on better participation, the next technical reference is the Bollinger upper band at HKD 124.15. If price slips back below the SMA50 at HKD 112.71, the short-term recovery would start to look less convincing, especially if volume stays soft. If the stock loses the HKD 92.85 support, the chart would shift into a much weaker posture.
Technical Verdict: HOLD (wait & see)
HOLD (wait & see)
- MACD is positive, showing momentum is still constructive.
- RSI is neutral at 52.5 and Stochastic is neutral, so the chart is not stretched but also not strongly impulsive.
- Price is above SMA20 and near SMA50, which supports the rebound, but volume is only 0.7x normal, so confirmation is incomplete.
Verdict invalidated if price falls below HKD 92.85.
- Ideal entry range: HKD 107.93 to HKD 112.71
- Exit target: HKD 117.00, then HKD 124.15
- Stop loss protection: HKD 92.85
In plain English: the chart is improving, but the move still needs stronger confirmation before it can be treated as a cleaner trend.
Alibaba’s latest close in Hong Kong was HKD 113.60.
Summary Data Alibaba
| Last price | 113.60 HKD |
| Change 1 day / 5 days / 1 month | 2.34% / -2.91% / 22.15% |
| Trend / MA-cross | sideways / none |
| SMA20 / SMA50 | 107.93 / 112.71 |
| RSI (14) / Stochastic %K | 52.5 / 35.7 |
| Bollinger %B / ATR | 67% / 5.26 |
| Support / Resistance 20 days | 92.85 / 117.00 |
| Data as of | 28 Juli 2026 08:30 WIB |



