DBS RSI Overbought: Stock Gains 0.83% (Juli 30, 2026)
On Juli 30, 2026: price 75.00 SGD, trend uptrend, RSI 76.3, support 65.43, resistance 74.38. technical analysis of dbs stock. DBS RSI Overbought — full details…

DBS Group’s shares on SGX were last quoted at 75.00 SGD, up 0.83% on the day and extending a strong 1 month gain of 14.68%, according to data from Yahoo Finance at 28 July 2026, 08:00 WIB. The move leaves the stock above its recent ceiling of 74.38 and just beyond the top of the 3 month range, a sign that buyers are still pressing the stock higher even as the technical picture starts to look stretched. In plain terms: the trend remains upward, but the pace of the advance is now moving into the zone where rallies often start to lose some ease.
Trend & Price Action
DBS is trading well above both its SMA20 at 70.87 and SMA50 at 66.67, which is the clearest sign that the broader trend is still constructive. The SMA20 is rising at 2.92% over 5 days, so the short-term average is not just below price; it is also climbing, which usually means momentum has been persistent rather than a one-day spike. There is no fresh MA cross, but that matters less here than the fact that price is already sitting comfortably above both moving averages. As shown in the chart, that positioning keeps the trend bias pointed upward.
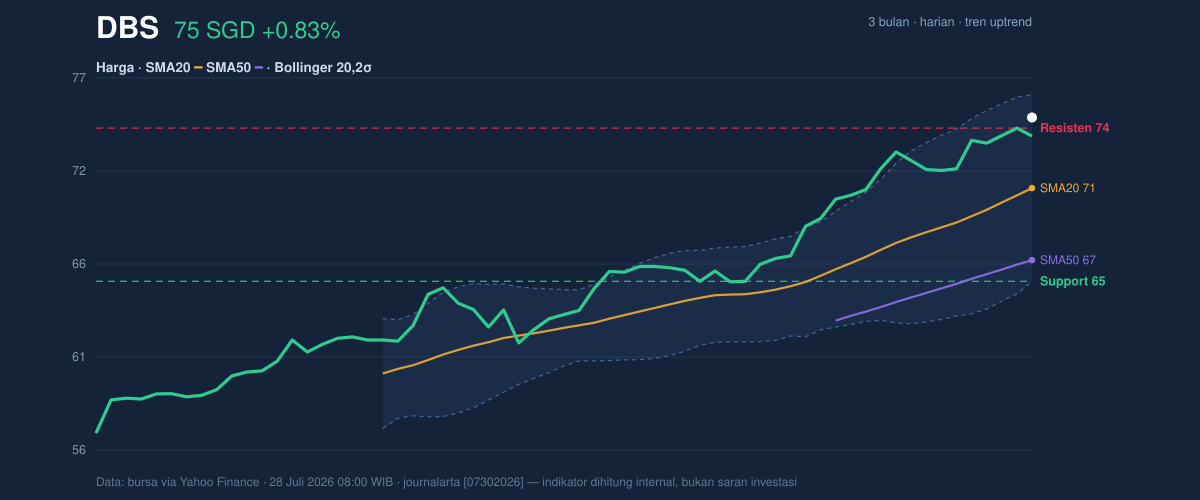
The catch is that the stock is now trading at 107% of its 20-hour range, with the latest price above the listed resistance at 74.38. That tells us the market is no longer buying DBS at a discount to the recent range; it is paying up for continued strength. When a stock sits near the top of its range and above the upper Bollinger band, it often signals enthusiasm, but also a thinner margin for error.
A strong trend can still be a crowded one.
Oscillators & Momentum
The momentum gauges are flashing a clear warning label. RSI at 76.3 is in overbought territory, while Stochastic %K at 90.6 and %D at 96.9 are also overbought. For general readers, that does not mean the stock must fall immediately; it means recent gains have been strong enough that the market may be getting ahead of itself in the short run. In practice, overbought readings often show that upside is still possible, but the next move may be less smooth and more vulnerable to pullbacks or sideways consolidation.
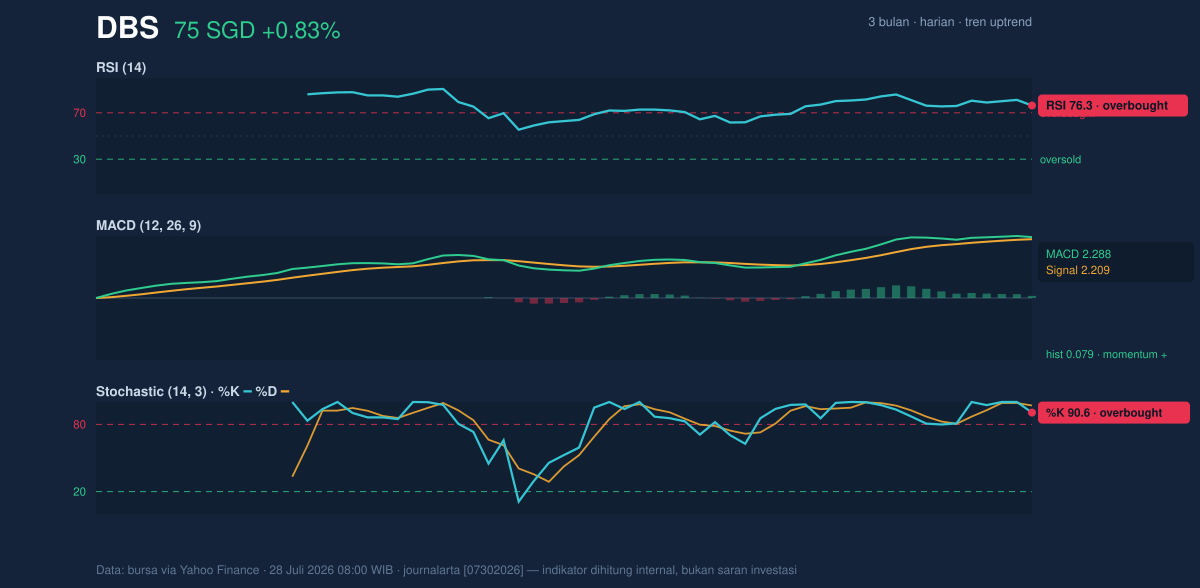
The one stabilising element is the MACD. MACD at 2.288 sits above its signal line at 2.209, with a positive histogram of 0.079. That combination means the upward trend still has active support from momentum, even if the oscillators are already hot. In other words, the trend is not breaking down; it is simply becoming more extended. The chart shows a market that is still advancing, but with momentum indicators now closer to exhaustion than acceleration.
Volatility & Volume
Bollinger Bands help frame how stretched the move has become. DBS is trading near the upper band at 76.32, with %B at 88%. %B measures where price sits within the Bollinger envelope, so a reading this high means the stock is close to the upper edge of its recent volatility channel. The Bollinger band width of 15.4% is described as normal, which matters because this is not a squeeze setup waiting for a breakout; it is already a trending move operating within ordinary volatility. That usually favours continuation more than a sudden expansion, but it also leaves the stock exposed if buying pressure fades.
ATR(14) at 1.21, or 1.6% of price, points to moderate day-to-day movement. That is enough to keep short-term swings meaningful, but not so high that the move looks disorderly. Volume adds a more nuanced message: the latest turnover of 5,454,100 was about 1.3× the 20-hour average of 4,199,327, which suggests participation is healthy. Yet OBV is falling, and that divergence matters. OBV, or on-balance volume, is a cumulative measure of whether volume is supporting price advances. When it slips while price rises, it can hint that the rally is not being confirmed by broad accumulation. That does not reverse the trend on its own, but it does make the move look less durable than the price chart alone suggests.
The rally is active, but not fully clean.
Key Levels & Scenarios
The nearest technical floor is the support at 65.43, which also matches the lower Bollinger band. That level is important because it sits well below the current price and marks the point where the recent trend structure would begin to look damaged. On the upside, the immediate reference is the resistance at 74.38, which has already been exceeded, while the next visible ceiling is the upper Bollinger band at 76.32. If the stock can hold above 74.38 and keep momentum intact, the market is effectively asking whether the current overbought condition can be absorbed by continued demand. If it slips back below 74.38, that would suggest the breakout is losing conviction and the stock may need to digest recent gains before attempting another leg higher.
Core view: DBS remains in an uptrend, but the combination of overbought RSI, overbought Stochastic, and a falling OBV means the advance is strong yet increasingly stretched.
Technical Verdict: HOLD (wait & see)
- Why this verdict: price is above SMA20 and SMA50, MACD remains positive, and volume is running at 1.3× normal.
- Why caution is still needed: RSI at 76.3 and Stochastic at 90.6 / 96.9 are overbought, while OBV is declining, which weakens confirmation.
- Verdict invalidated if price breaks below 65.43, the key support and lower Bollinger band.
- Ideal Entry Range: 70.87 to 74.38
- Exit Target: 76.32
- Stop Loss protection: 65.43
For non-traders, this means DBS is still trending higher, but the stock looks hot enough that patience matters more than chasing strength. “The market is still rewarding the trend, but it is also asking a simple question: how much more fuel is left?”
Summary Data DBS
| Last price | 75.00 SGD |
| Change 1 day / 5 days / 1 month | 0.83% / 4.17% / 14.68% |
| Trend / MA-cross | uptrend / none |
| SMA20 / SMA50 | 70.87 / 66.67 |
| RSI (14) / Stochastic %K | 76.3 / 90.6 |
| Bollinger %B / ATR | 88% / 1.21 |
| Support / Resistance 20 days | 65.43 / 74.38 |
| Data as of | 28 Juli 2026 08:00 WIB |



