OCBC RSI Overbought: Stock Gains 1.67% (Juli 30, 2026)
On Juli 30, 2026: price 29.78 SGD, trend uptrend, RSI 73.3, support 24.66, resistance 29.29. technical analysis of ocbc stock. OCBC RSI Overbought — full…

OCBC Bank’s shares on the SGX were last quoted at SGD 29.78, up 1.67% from the previous close of SGD 29.29, and the move keeps the counter pinned near the top of its recent trading band, as shown in the chart. The stock has gained 3.98% over five days and 20.13% over one month, a pace that signals more than a routine bounce: it suggests buyers have been willing to pay up for the bank even after a strong run. With the price now above both the SMA20 at 27.61 and the SMA50 at 25.46, the trend remains firmly constructive, although momentum is starting to look stretched.
Trend & Price Action
The chart shows a clean upward structure rather than a choppy recovery. OCBC is trading above its short- and medium-term averages, and the uptrend is reinforced by the SMA20 slope of 3.95% over five days. That matters because a rising moving average is not just a lagging line on a chart; it is a sign that recent closes have been consistently stronger than earlier ones, which usually reflects persistent demand.
There is no fresh moving-average crossover to point to, so the message comes from alignment rather than a new trigger. In practical terms, the stock has already done the work of establishing trend direction, and the current question is whether it can extend that trend without pausing for consolidation. The price is also sitting at 111% of its 20-hour range, very close to the 3-month high of 29.30, which tells traders the shares are pressing against the upper edge of recent history rather than moving in the middle of it.
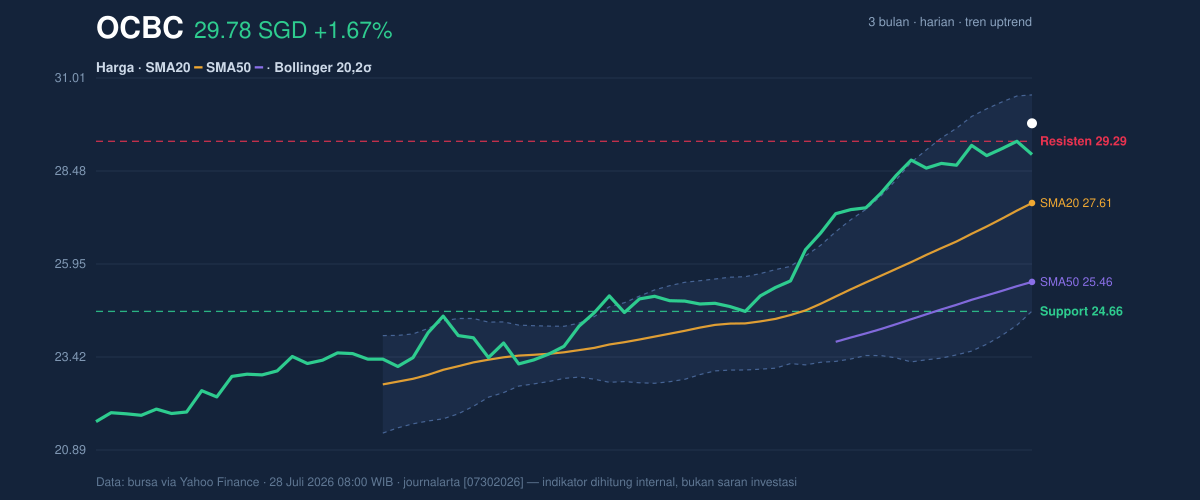
The nearest reference point from the data is the 20-hour resistance at 29.29, which has effectively been tested and overtaken by the latest print. That is a positive sign, but it also means the market is now asking a harder question: can the breakout hold, or is this the kind of move that invites profit-taking near a familiar ceiling?
Oscillators & Momentum
The momentum picture is strong, but not cleanly comfortable. As shown in the chart, the RSI at 73.3 and Stochastic %K at 83.5 / %D at 93.6 both sit in overbought territory. That does not mean the stock must fall; it means the recent advance has been fast enough that short-term enthusiasm may already be elevated. In plain language, momentum is positive, but it is also extended.
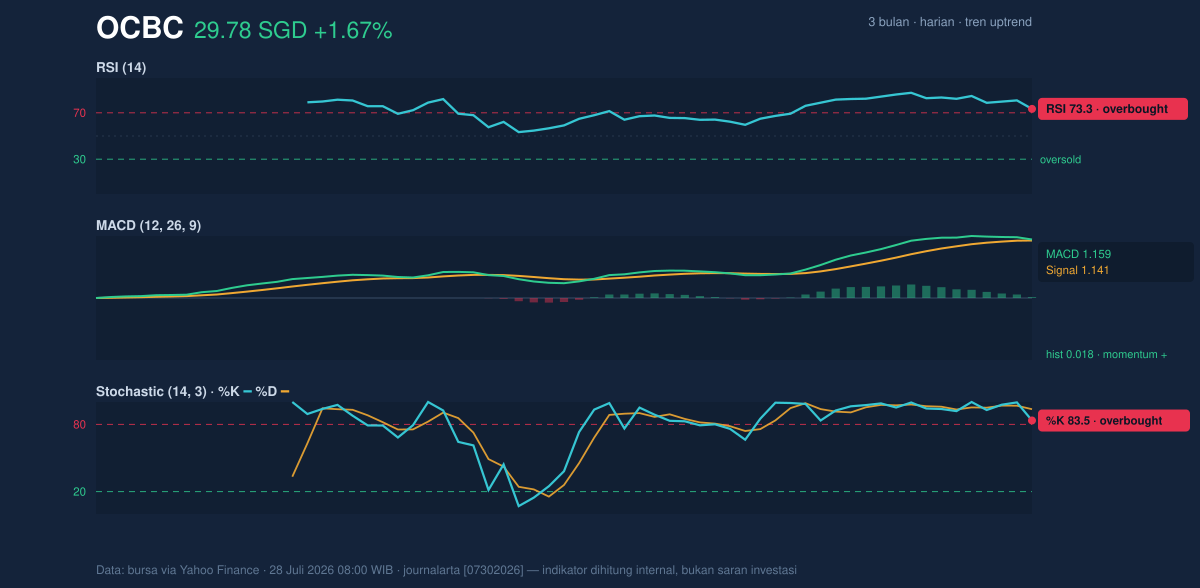
The MACD at 1.159 remains above the signal line at 1.141, with a small positive histogram of 0.018. This is important because MACD is still confirming upward momentum rather than warning of a reversal. However, the narrow gap between the MACD line and its signal line suggests the bullish push is present, but not especially powerful. That combination often appears when a stock is climbing, yet the rate of ascent is beginning to cool.
The takeaway from the oscillators is straightforward: the trend is still upward, but the stock is no longer in a neutral zone where new buying is being absorbed quietly. It is in a zone where strength is visible enough to attract attention, and that can sometimes lead to sideways movement before any further advance.
Volatility & Volume
Volatility is not low, and that matters for how the next move may unfold. The Bollinger Bands are widening, with a band width of 21.3%, which points to expanding price dispersion and a more active trading environment. The price is also near the upper band at 30.55, with %B at 87%, meaning OCBC is trading close to the top of its recent volatility envelope. In simple terms, the shares are running hot relative to their recent range.
At the same time, the ATR of 0.55 — about 1.8% of price — indicates movement is still manageable rather than chaotic. That combination is useful: the stock is volatile enough to move, but not so unstable that every session becomes noise.
Volume adds a more nuanced signal. Last trading volume of 5,512,200 was below the 20-day average of 6,281,815, or about 0.9x normal. That means the latest price rise was not backed by unusually heavy participation. Yet OBV is rising, which suggests the broader flow of volume has still been supportive over time. So while the latest session did not come with a surge of activity, the underlying accumulation picture has not broken down.
Key Levels & Scenarios
The market is now working around a tight set of reference points. The support at 24.66 marks the lower edge of the 20-hour range, while the resistance at 29.29 has been challenged and is now the nearest line to watch. Above that, the Bollinger upper band at 30.55 becomes the next technical ceiling if the breakout continues.
If OCBC holds above 29.29, the chart suggests the stock could keep trading near the top of its range, with the upper band at 30.55 acting as the next visible test. If it fails to hold above that level, the more meaningful risk is not an immediate trend reversal but a cooling phase back toward the SMA20 at 27.61, where the market would likely reassess whether the recent advance has run too far, too fast.
Technical Verdict: HOLD (wait & see)
HOLD (wait & see)
- RSI at 73.3 and Stochastic at 83.5 / 93.6 show the stock is overbought, so upside is still possible but short-term exhaustion risk is elevated.
- MACD remains positive at 1.159 versus 1.141, which keeps the uptrend intact, while the price above SMA20 and SMA50 confirms the broader structure is still constructive.
- Bollinger Bands are widening and price is near the upper band at 30.55, implying the move has strength but is also approaching a zone where consolidation often appears.
- Verdict invalidated if price falls below 27.61, the SMA20, because that would weaken the current trend structure and suggest the recent momentum is fading.
- Ideal Entry Range: 27.61 to 29.29
- Exit Target: 30.55
- Stop Loss protection: 24.66
For non-traders, this means OCBC still looks technically strong, but it is already close to a short-term stretched zone, so the chart is asking for patience rather than urgency.
Summary Data OCBC
| Last price | 29.78 SGD |
| Change 1 day / 5 days / 1 month | 1.67% / 3.98% / 20.13% |
| Trend / MA-cross | uptrend / none |
| SMA20 / SMA50 | 27.61 / 25.46 |
| RSI (14) / Stochastic %K | 73.3 / 83.5 |
| Bollinger %B / ATR | 87% / 0.55 |
| Support / Resistance 20 days | 24.66 / 29.29 |
| Data as of | 28 Juli 2026 08:00 WIB |



