Alibaba Momentum Gains: Stock Drops 0.18% (Juli 31, 2026)
On Juli 31, 2026: price 111.80 HKD, trend sideways, RSI 55.0, support 94.10, resistance 117.00. technical analysis of alibaba stock. Alibaba Momentum Gains —…

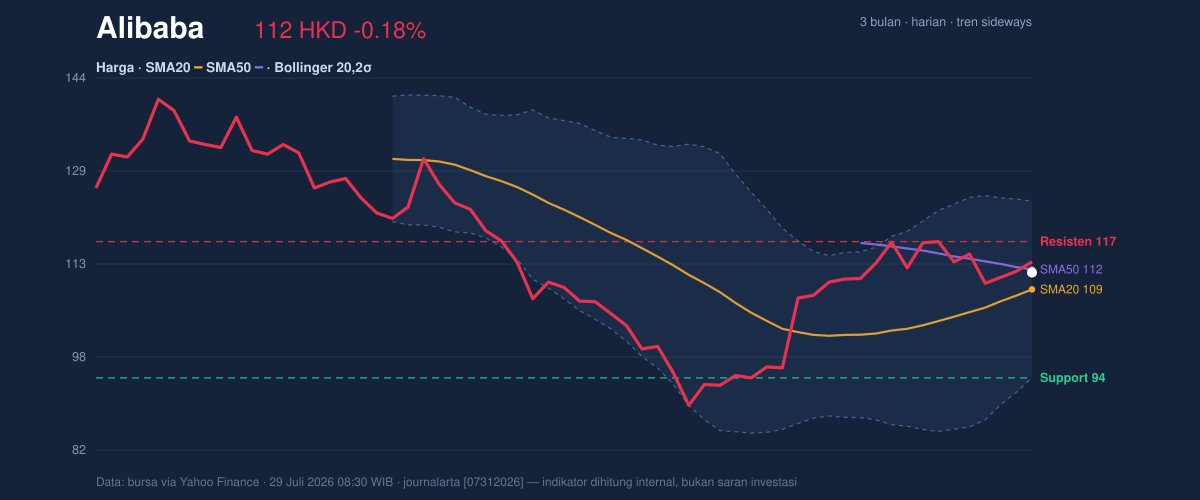
Alibaba Group’s Hong Kong-listed shares fell 0.18% to HK$111.80 in the latest session on HKEX, a modest pullback that leaves the stock still trading above its 20-day average of HK$108.97 but below its 50-day average of HK$112.34, according to data via Yahoo Finance as of 29 July 2026, 08:30 WIB. That positioning matters: it suggests the recent rebound has not yet turned into a clean trend reversal, even though the share price remains 20.41% higher over one month and sits well above the lower half of its 3-month range of HK$88.65 to HK$144.00. The message from the tape is not euphoria, but resilience.
Trend & Price Action
The chart shows a stock that is still in a sideways trend, even with the SMA20 rising 4.39% over 5 days. That upward slope on the short-term average is important because it signals improving near-term momentum, but the fact that price is still under the SMA50 means medium-term sellers have not fully been cleared out. In plain language: Alibaba is recovering, but it has not yet proven that the recovery can sustain above the more stubborn trend line.
The location within the range adds another layer. With the stock at 77% of its 20-hour range, it is closer to resistance than support, which implies the market has already priced in much of the latest bounce. As shown in the chart, the next test is whether buyers can push through the nearby ceiling rather than simply defend the recent advance.
That is a constructive setup, but not a decisive one.
Oscillators & Momentum
The momentum gauges are mostly telling the same story: improving, but not stretched. RSI(14) at 55.0 is neutral, which means the stock is neither overbought nor oversold and still has room to move in either direction without immediate technical exhaustion. The Stochastic %K at 47.1 and %D at 47.3 are also neutral, showing no strong short-term reversal signal and no sign that the stock is overheated after the recent monthly rise.
The more supportive signal comes from MACD. MACD at 1.270 is above its signal line at 0.637, with a positive histogram of 0.633. That combination usually means upward momentum is still present beneath the surface, even if price action has paused. For general readers, MACD is a trend-following indicator: when the faster line stays above the slower one, it often suggests buyers still have the upper hand, at least for now.
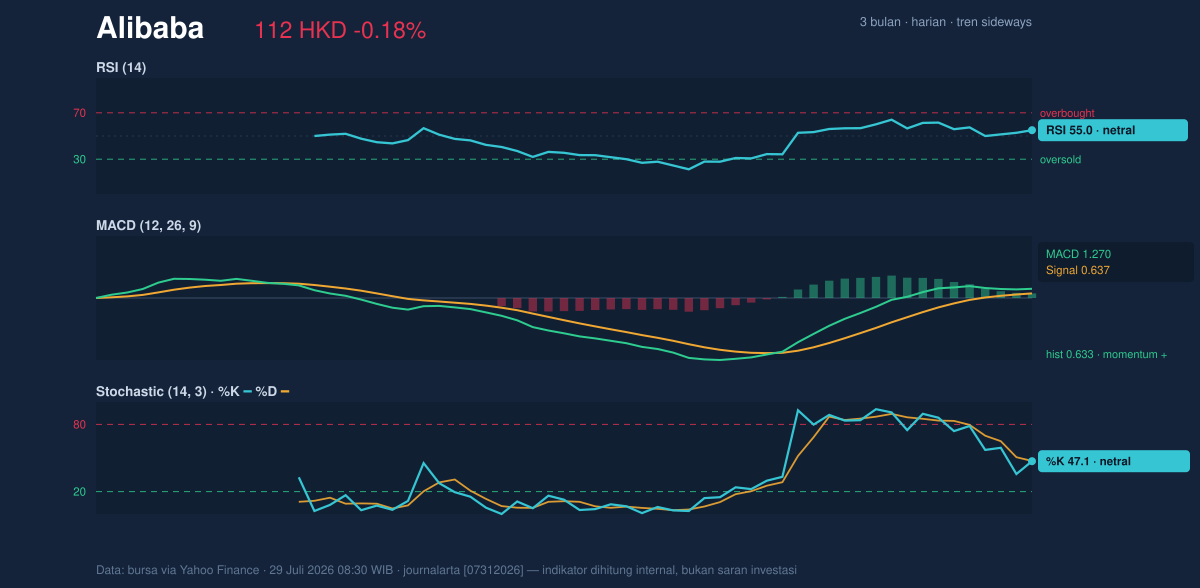
So the oscillators are not flashing a breakout, but they are also not warning that the move is exhausted.
Volatility & Volume
Volatility is elevated. The Bollinger Bands are wide, with a 27.2% band width and ATR(14) at 5.15, or 4.6% of price. ATR, or average true range, is a measure of how much a stock tends to move in a day; at this level, Alibaba is capable of relatively sharp swings in either direction. The %B reading of 60% places price above the middle band at HK$108.97 but still well below the upper band at HK$123.79, which indicates the stock has recovered into a healthier part of the range without yet pressing into overbought territory.
Volume, however, tempers the enthusiasm. Last session volume of 93,154,775 was only 0.8x the 20-session average of 112,826,943. That means the latest move was not backed by unusually strong participation. In technical terms, a rally on lighter volume can still work, but it is less convincing than one accompanied by a surge in trading. The positive counterweight is that OBV is rising, which suggests the broader balance of accumulated buying pressure has been improving even if the latest day was quiet.
This is a market that is leaning upward, not charging.
Key Levels & Scenarios
The most important nearby levels are clear in the chart. Support sits at HK$94.10, very close to the 3-month low of HK$88.65, while resistance is at HK$117.00. That resistance is especially important because it is also close to the SMA50 at HK$112.34, creating a band where the stock may face clustered supply from traders watching the same area.
If Alibaba can clear HK$117.00, the next technical signal would be that the recent rebound is beginning to challenge the broader sideways structure. If it fails there, the stock could slip back toward the SMA20 at HK$108.97, which is currently acting as the first meaningful pivot. A break below that average would weaken the short-term recovery narrative and put the lower support zone back in focus.
The key point is that the price is still positioned between a rising short-term base and a more resistant medium-term ceiling.
Technical Verdict: HOLD (wait & see)
HOLD (wait & see)
- MACD is positive, which supports the current rebound, but the stock is still below the SMA50 at HK$112.34, so the medium-term trend is not yet fully confirmed.
- RSI at 55.0 and Stochastic at 47.1/47.3 are neutral, meaning momentum is constructive but not strong enough to call a breakout.
- Bollinger Bands are widening and ATR is high at 5.15, so the stock can move sharply, but volume is only 0.8x normal, limiting confirmation.
- Invalidation condition: this verdict is invalidated if price falls below HK$108.97, the SMA20 and Bollinger middle band.
- Ideal Entry Range: HK$108.97 to HK$112.34
- Exit Target: HK$117.00 to HK$123.79
- Stop Loss protection: below HK$94.10
For non-traders: the chart says Alibaba is recovering, but it has not yet proved that the rebound is strong enough to break the next wall.
Alibaba’s last close was HK$111.80.
Summary Data Alibaba
| Last price | 111.80 HKD |
| Change 1 day / 5 days / 1 month | -0.18% / -1.58% / 20.41% |
| Trend / MA-cross | sideways / none |
| SMA20 / SMA50 | 108.97 / 112.34 |
| RSI (14) / Stochastic %K | 55.0 / 47.1 |
| Bollinger %B / ATR | 60% / 5.15 |
| Support / Resistance 20 days | 94.10 / 117.00 |
| Data as of | 29 Juli 2026 08:30 WIB |
