BP Momentum Gains: Stock Gains 3.27% (Juli 31, 2026)
On Juli 31, 2026: price 542.90 GBp, trend sideways, RSI 60.4, support 464.40, resistance 555.90. technical analysis of bp stock. BP Momentum Gains — full…

BP plc is trading near the upper end of its recent range, with the market leaning bullish but not yet fully confirmed by volume. The shares last changed hands at 542.90 GBp, up 3.27% on the day and 19.16% over the past month, according to exchange-based data via Yahoo Finance. That move matters for international readers because BP is not just reacting to oil prices; it is also showing how far sentiment can stretch when a large-cap energy name trades above its near-term averages while momentum indicators start to diverge.
Trend & Price Action
The price sits above SMA20 at 509.22 and above SMA50 at 514.06, which is the first sign that the short-term structure has improved. But the broader read is still sideways, not a clean uptrend. That distinction matters: a sideways trend with price above both moving averages often means buyers have regained control of the near-term tape, yet the market has not committed to a fresh directional leg.
There is no new MA cross, so there is no fresh moving-average signal to imply a regime change. The SMA20 slope of 3.69% over 5 days shows the nearer average is rising, which supports the current bounce. Still, the stock is already trading near the top of its tactical range: the 20-hour resistance is 555.90, while support is 464.40, and the share price is sitting at 86% of that range. As shown in the chart, that positioning means the market is closer to resistance than to support, so upside now depends on follow-through rather than simple mean reversion.
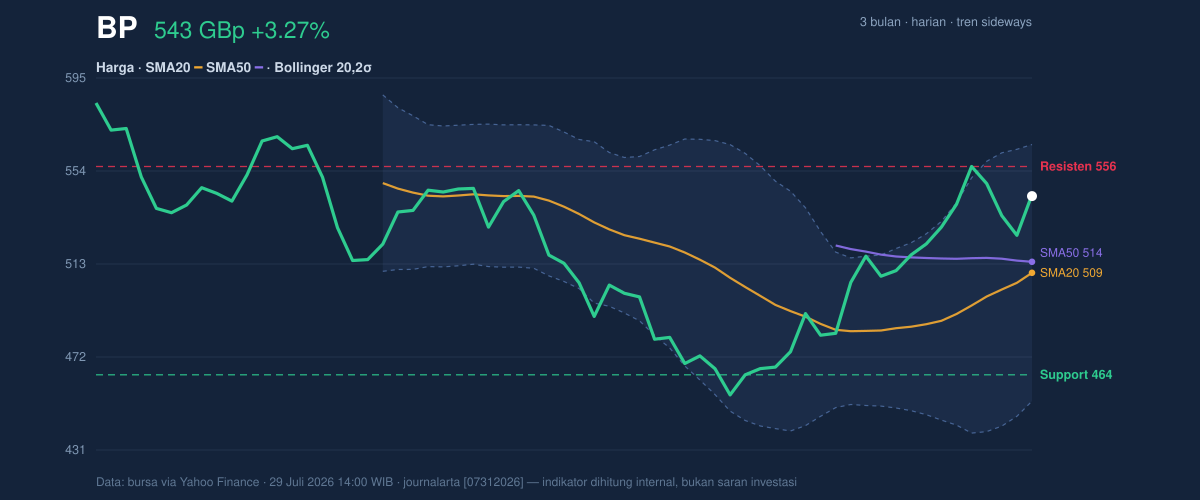
The broader three-month range reinforces that point. BP has moved well off the 3-month low of 450.60, but it still trades below the 3-month high of 585.90. In plain terms, the stock has repaired its chart, yet it has not broken out of the wider band that has contained the last quarter.
Oscillators & Momentum
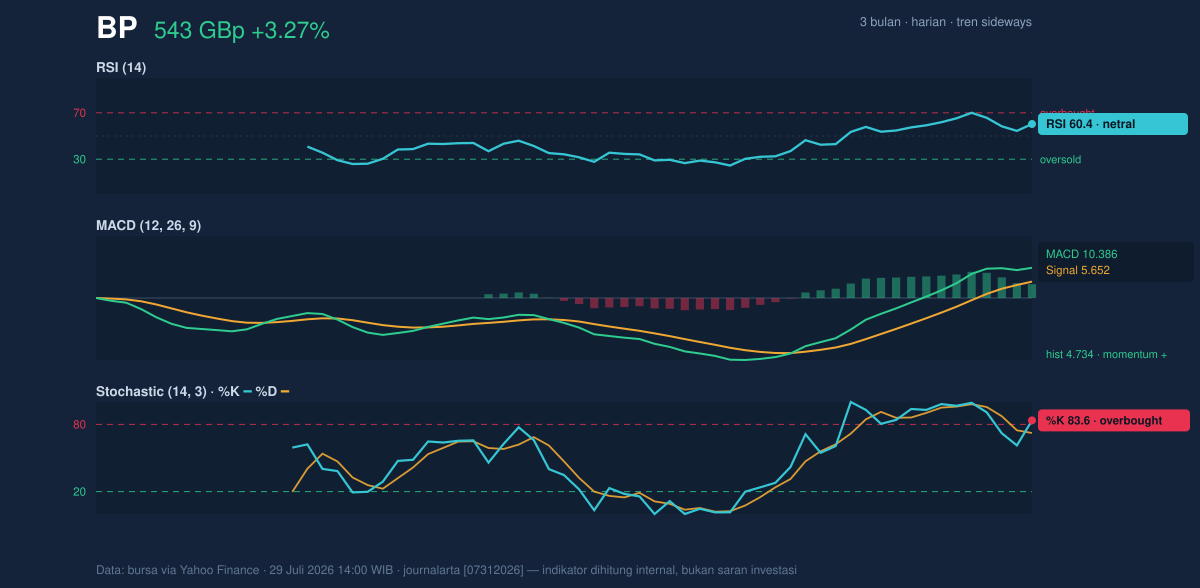
Momentum is constructive, but it is not uniformly supportive. The RSI at 60.4 is best read as neutral-to-firm: it suggests buyers are active, but the market is not yet in an extreme condition. By contrast, the Stochastic oscillator at 83.6 / 72.3 is in overbought territory, which usually means the latest push has been strong enough to leave the price vulnerable to pauses or shallow pullbacks. That does not automatically signal a reversal; it often signals that momentum has run ahead of itself.
The MACD at 10.386 is above its signal line at 5.652, with a histogram of 4.734, and that combination still points to positive momentum. In practical terms, MACD is telling investors that recent gains are stronger than the slower trend measure, so the tape is still biased upward. The tension here is important: MACD says the trend has upside energy, while Stochastic says that energy is getting stretched. When those two disagree, price often spends time consolidating rather than accelerating immediately.
Volatility & Volume
The Bollinger band structure adds another layer. BP is trading at %B of 80%, which places it in the upper portion of the band range and near the upper band at 565.56. The band width has expanded to 22.1%, meaning volatility is rising. Expanding bands usually indicate that the market is moving out of a quiet phase and preparing for a larger price swing. That swing can continue in either direction, but when price is already near the top of the band, the immediate risk is that the next move becomes choppy rather than linear.
ATR at 14.43, equal to 2.7% of price, confirms a moderate daily swing environment. So while volatility is not extreme, it is high enough that short-term traders will want to respect nearby support and resistance rather than assume smooth continuation.
Volume, however, is the caution flag. Last volume was 30,979,815, below the 20-hour average of 37,490,580, or about 0.8× normal. That means the latest rise has not yet been backed by full participation. The OBV is rising, which is helpful because it suggests accumulation has been building underneath the price, but the lighter turnover means the move still needs stronger confirmation from the market as a whole.
Key Levels & Scenarios
The immediate technical map is clear. 555.90 is the first level to watch on the upside, because it is both the 20-hour resistance and the nearest ceiling on the chart. A clean move through that area would put the upper Bollinger band at 565.56 and then the 3-month high of 585.90 back into focus. On the downside, 514.06 and 509.22 are the first moving-average supports, while 464.40 is the more important range support if the stock loses momentum.
If BP fails to clear 555.90, the chart likely stays range-bound and may drift back toward the 514.06 to 509.22 zone. If it breaks below 509.22, the current bounce loses some of its technical credibility. If it falls through 464.40, the recovery structure from the recent rebound would be seriously weakened.
Technical Verdict: HOLD (wait & see)
HOLD (wait & see)
- MACD is positive, so the underlying momentum still supports the recent advance.
- Price is above SMA20 and SMA50, which keeps the short-term structure constructive.
- Stochastic is overbought and volume is only 0.8× normal, so the breakout case is not yet fully confirmed.
Verdict invalidated if price falls below 509.22, because that would place BP back under the short-term trend line and weaken the current bullish setup.
- Ideal Entry Range: 509.22 to 514.06
- Exit Target: 555.90 to 565.56
- Stop Loss Protection: 464.40
In plain English, BP looks stronger than it did a month ago, but the chart is still asking for confirmation before the move can be trusted.
Summary Data BP
| Last price | 542.90 GBp |
| Change 1 day / 5 days / 1 month | 3.27% / 0.67% / 19.16% |
| Trend / MA-cross | sideways / none |
| SMA20 / SMA50 | 509.22 / 514.06 |
| RSI (14) / Stochastic %K | 60.4 / 83.6 |
| Bollinger %B / ATR | 80% / 14.43 |
| Support / Resistance 20 days | 464.40 / 555.90 |
| Data as of | 29 Juli 2026 14:00 WIB |
