DBS Stock Analysis: Gains 1.27%, RSI Overbought
On Juli 31, 2026: price 74.85 SGD, trend uptrend, RSI 79.2, support 66.43, resistance 75.00. technical analysis of dbs stock. DBS Stock Analysis — full details…

At SGD 74.85, DBS Group is trading within striking distance of its SGD 75.00 20-day resistance and the 3-month high of SGD 75.00, according to Yahoo Finance data as of 29 July 2026 08:00 WIB. The share has climbed 1.27% in the latest session, 1.62% over five days and 14.40% over one month, which places the stock firmly in an uptrend. But the message from the chart is not simply “strong”: it is “extended.” Price is sitting above the short- and medium-term moving averages, yet the oscillators are flashing overheated conditions, suggesting the rally has traveled fast enough to invite pauses even while the broader structure remains constructive.
Trend & Price Action
The trend picture is still positive. DBS is trading above its SMA20 at SGD 71.35 and well above its SMA50 at SGD 66.93, a configuration that usually signals that recent buying has been strong enough to keep the stock ahead of both short- and medium-term averages. The SMA20 slope of 3.06% over five days reinforces that point: the trend is not just above average, it is still rising. As shown in the chart, price is also near the top of the recent range, at 98% of the 20-hour band, which means most of the move has already happened and there is little room left before the next visible ceiling.
The Bollinger Bands add an important nuance. With the upper band at SGD 76.47, the stock is approaching the edge of its recent volatility envelope, while the middle band at SGD 71.35 aligns with the SMA20 and acts as the first meaningful area where momentum could cool. The 14.3% band width is described as normal, not squeezed, so this is not a classic quiet-before-the-storm setup; instead, it suggests the stock has enough room to move, but it is already moving near the upper boundary of that room.
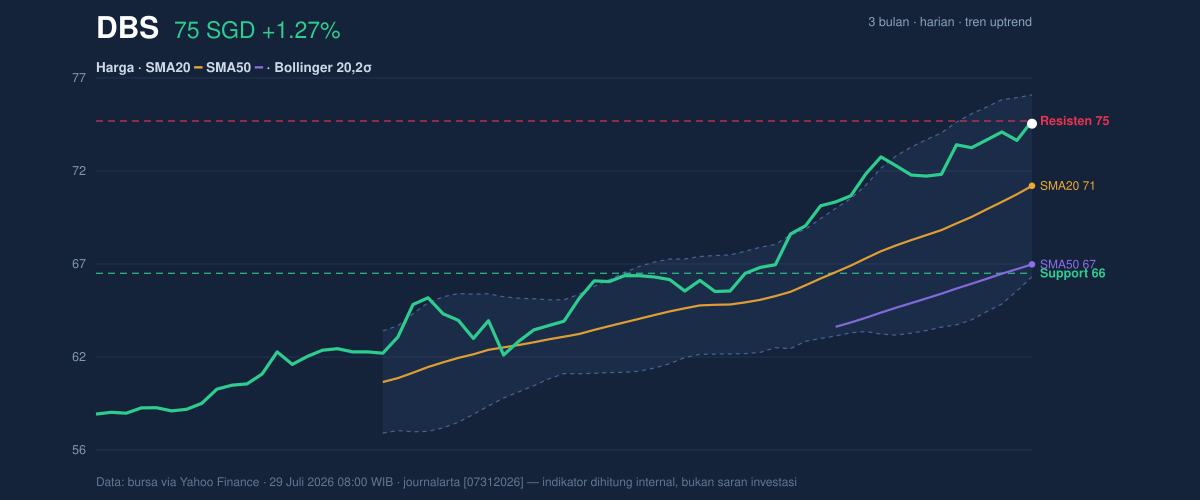
In plain terms: DBS is strong, but it is also close to where strength often meets hesitation.
Oscillators & Momentum
The momentum indicators are aligned on the bullish side, but they are also stretched. The RSI(14) at 79.2 is firmly in overbought territory, which usually means recent gains have been fast enough that the stock may be vulnerable to consolidation or a brief pullback. The Stochastic %K at 100.0 and %D at 96.9 are also overbought, and that matters because Stochastic tends to highlight when price is closing near the top of its recent range. In other words, the stock is not merely rising; it is finishing sessions near the highs of the move, which often precedes a cooling period.
At the same time, the MACD at 2.300 remains above the signal line at 2.208, with a positive histogram of 0.092. That tells us trend momentum is still positive and has not yet rolled over. This combination — overbought RSI and Stochastic, but positive MACD — is a classic late-stage uptrend signal: the trend is intact, yet the pace may be too hot to sustain without interruption.
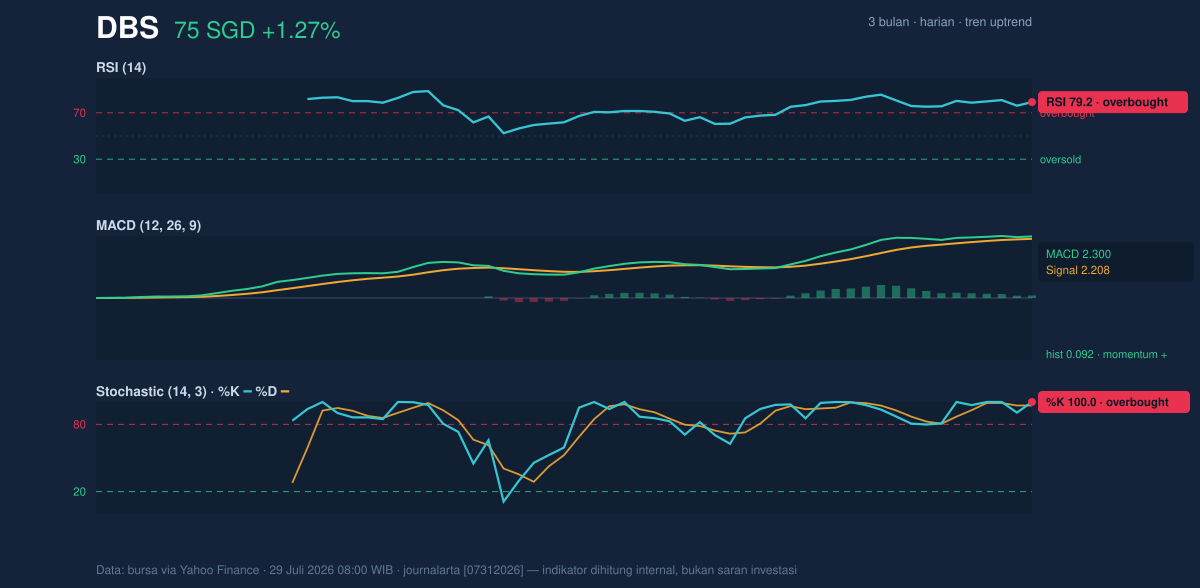
The chart is saying “uptrend,” but the oscillators are also saying “don’t chase the last stretch blindly.”
Volatility & Volume
Volatility is moderate rather than explosive. The ATR(14) of 1.21, equal to 1.6% of price, suggests DBS can still move meaningfully in a single session, but not in a disorderly way. That matters because a stock trading near resistance with moderate volatility can either break out cleanly or stall and rotate back toward support; the difference often comes down to participation.
Participation, however, is mixed. Last volume was 3,965,700, below the 20-day average of 4,254,214, or about 0.9× normal. That means the latest push higher did not come with stronger-than-usual trading interest. More importantly, OBV is down, which is a cautionary signal because On-Balance Volume tracks whether volume is flowing in a way that supports the price trend. When price is near highs but OBV is falling, it can imply that the rally is advancing on thinner internal support than the chart alone suggests.
So the pattern is clear: price is elevated, momentum is positive, but volume confirmation is not fully keeping pace.
Key Levels & Scenarios
The nearest reference points are straightforward. The key support at SGD 66.43 sits well below current trading and lines up with the lower part of the recent range, while resistance at SGD 75.00 is now directly in front of the share price. Because DBS is already trading near the top of the range, the immediate question is whether it can convert resistance into support. If it does, the chart would shift from “extended rally” to “breakout continuation.” If it fails, the likely consequence is a retreat toward the SMA20 at SGD 71.35 and possibly the Bollinger middle band, where the market has already shown it is willing to pause.
The most important signal is not the absolute level of SGD 75.00; it is whether price can hold above it with better participation than the latest session.
Technical Verdict: HOLD (wait & see)
HOLD (wait & see) fits the current setup because the trend remains positive, but the stock is also showing clear overextension.
- RSI 79.2 and Stochastic 100.0/96.9 are both overbought, signaling stretched near-term conditions.
- MACD 2.300 above signal 2.208 still confirms positive momentum, so the broader uptrend has not broken.
- Volume at 0.9× normal and OBV down weaken the case for a decisive breakout above resistance.
Verdict invalidated if price breaks below SGD 66.43, which would mean the current range structure has failed and the recent advance has lost its footing.
Ideal Entry Range: SGD 71.35 to SGD 66.43, where price would be closer to the SMA20 and support zone rather than at resistance.
Exit Target (Target Price): SGD 75.00 to SGD 76.47, the current resistance and upper Bollinger band.
Stop Loss Protection: below SGD 66.43, the nearest defined support.
For non-traders, this means DBS still looks strong, but the chart says the easy part of the rise may already be behind it.
“The stock is at the ceiling, and the question now is whether there is enough buying power left to push through it.”
Summary Data DBS
| Last price | 74.85 SGD |
| Change 1 day / 5 days / 1 month | 1.27% / 1.62% / 14.40% |
| Trend / MA-cross | uptrend / none |
| SMA20 / SMA50 | 71.35 / 66.93 |
| RSI (14) / Stochastic %K | 79.2 / 100.0 |
| Bollinger %B / ATR | 84% / 1.21 |
| Support / Resistance 20 days | 66.43 / 75.00 |
| Data as of | 29 Juli 2026 08:00 WIB |


