Golden Cross Formed, Shell Stock Gains 2.61% Today
On Juli 31, 2026: price 3,319.00 GBp, trend uptrend, RSI 64.1, support 2,891.50, resistance 3,344.00. technical analysis of shell stock.

Shell plc climbed on the London Stock Exchange on 29 July, with the shares changing hands at 3,319.00 GBp, up 2.61% on the day, as the stock pressed deeper into the upper half of its recent trading range. The move matters because it was not just a one-day bounce: Shell is now above its SMA20 at 3,145.25 and above its SMA50 at 3,122.02, while the shorter average is still rising, a combination that usually signals buyers are still in control rather than merely reacting to a headline.
Trend & Price Action
The chart shows a stock that has moved from recovery to confirmation. Shell is in an uptrend, with the SMA20 crossing above the SMA50 in a classic golden cross, which tells traders the recent pace of buying has overtaken the longer-running trend. That does not guarantee a straight line higher, but it does mean the market is no longer treating dips as a sign of structural weakness.
The current price is also sitting close to the top of the recent band, with 3,344.00 acting as the nearest 20-hour resistance and the shares already at 94% of the range. That positioning is important: when a stock is that close to resistance after a strong month, the market is usually testing whether momentum has enough fuel to extend, or whether some short-term profit-taking will appear first.
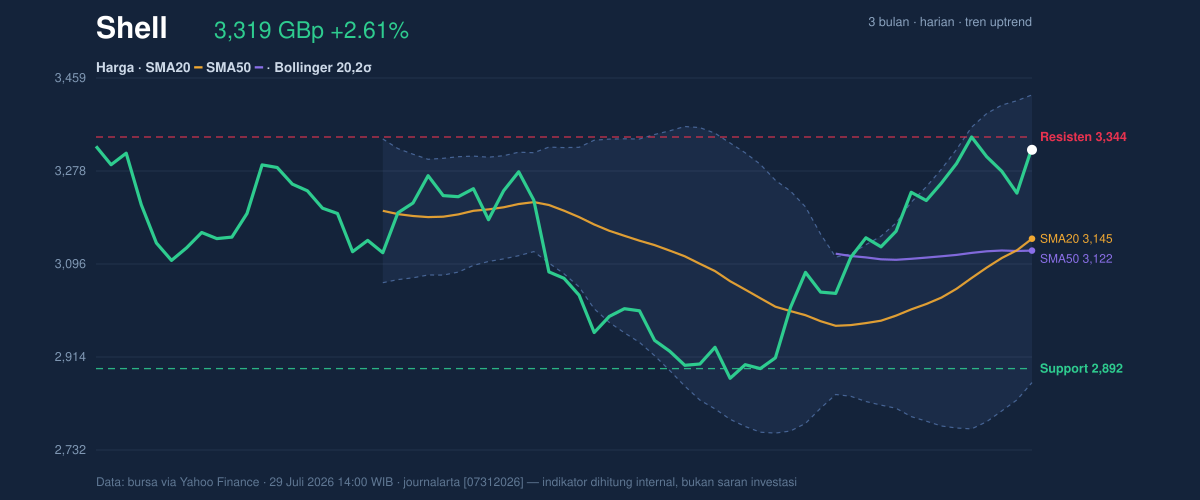
The broader map is still constructive. Shell is trading well above the Bollinger middle band at 3,145.25, and the upper band at 3,426.34 now becomes the next visible ceiling on the chart. In plain terms, the market has already priced in a fair amount of the recent advance, but it has not yet reached an extreme that would force a reversal on its own.
Oscillators & Momentum
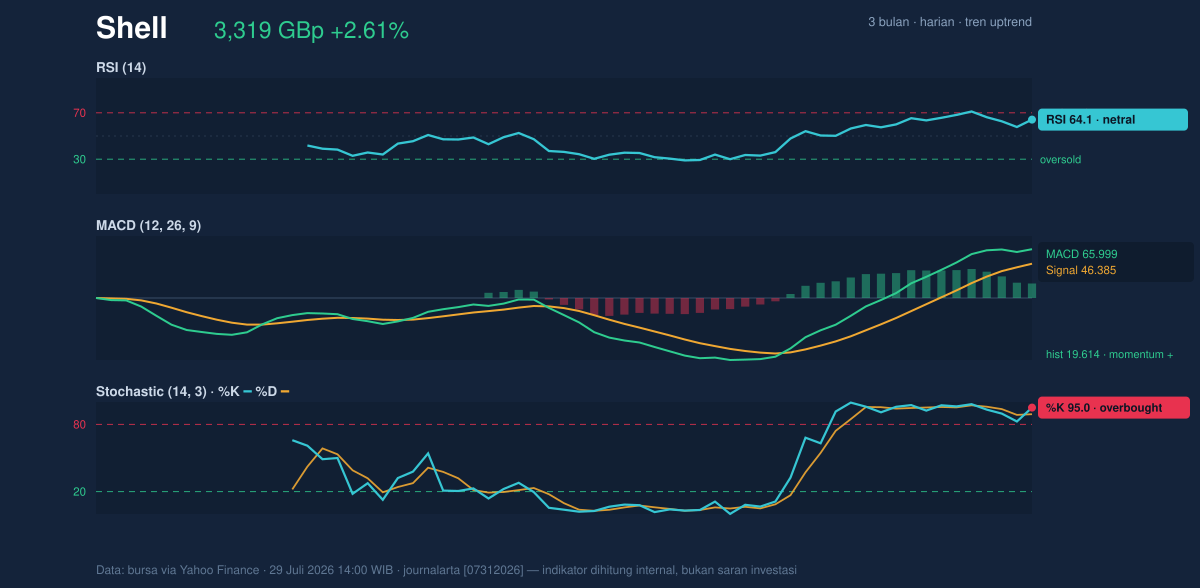
The momentum picture is mixed, and that mix is what makes the current setup interesting. RSI at 64.1 is still technically neutral, which means the rally is not yet stretched enough to be called overheated on that measure. But the Stochastic reading at 95.0 / 89.1 is overbought, and that is a warning that the latest burst higher may be running ahead of itself in the short term.
That tension matters. Stochastic tends to react quickly to price acceleration, so a reading this high often appears when a stock is climbing fast and traders have begun to crowd into the same move. It does not automatically mean the trend is ending; it means the stock may be vulnerable to pauses, especially if it cannot clear nearby resistance cleanly.
The stronger anchor here is the trend-following side of the tape. MACD at 65.999 remains above its signal line at 46.385, with a positive histogram of 19.614. That configuration shows momentum is still expanding in the direction of the trend, even if the faster oscillators are flashing caution. In simple terms, the rally still has confirmation from the broader momentum engine, not just from short-term enthusiasm.
Volatility & Volume
Volatility is present, but not disorderly. ATR(14) at 98.96 equals about 3.0% of the share price, which points to moderate daily movement rather than a compressed, sleepy market or a panic-driven one. The Bollinger Band width of 17.9% is described as normal, so the stock is not in a squeeze that often precedes a sudden breakout, nor is it showing a volatility spike that would suggest exhaustion.
That leaves volume as the most convincing confirmation signal. Shell traded 14,162,877 shares versus a 20-day average of 8,746,996, or about 1.6× normal activity, and OBV is rising. Rising on-balance volume means money is still flowing into the stock on balance, which is a meaningful sign because price advances supported by participation are usually more durable than moves built on thin trading.
The signal from the volume profile is that this is not a quiet drift higher. It is an advance with engagement behind it, which makes the current test of resistance more credible. If the shares can absorb supply near the top of the range, that would reinforce the idea that the market is accepting higher prices rather than merely chasing them.
Key Levels & Scenarios
The nearest support sits at 2,891.50, while the immediate resistance is 3,344.00. Those levels frame the present battle: above resistance, the stock has room to probe the Bollinger upper band at 3,426.34; below support, the recent breakout structure would start to lose credibility.
The three-month range adds context. Shell has traveled from 2,559.50 to 3,758.50, so the current price is not near the bottom of the larger range, but it is still below the prior high. That means the market has room to recover more of the earlier drawdown, yet it is also close enough to resistance that every incremental gain now requires stronger conviction.
If the shares push through 3,344.00 with volume still above average, the chart would suggest continuation toward the upper Bollinger band and a retest of the higher end of the recent range. If they fail there, the first place to watch is the support at 2,891.50, because a break below that level would suggest the move has run into distribution rather than consolidation.
Technical Verdict: HOLD (wait & see)
HOLD (wait & see)
- MACD remains positive, so the underlying trend still has confirmation.
- Price is above SMA20 and SMA50, and the golden cross supports the broader uptrend.
- Stochastic is overbought and price is already near 3,344.00 resistance, so short-term upside may be harder to earn immediately.
Verdict invalidated if price falls below 2,891.50, because that would break the nearest support and weaken the current bullish structure.
- Ideal Entry Range: 2,891.50 to 3,145.25
- Exit Target: 3,344.00 to 3,426.34
- Stop Loss protection: below 2,891.50
For non-traders, this means Shell still looks technically healthy, but the stock is close enough to resistance that the market is asking for proof before extending the move.
“We are not at the finish line yet — the next test is whether buyers can defend this advance when the stock is already this stretched.”
Summary Data Shell
| Last price | 3,319.00 GBp |
| Change 1 day / 5 days / 1 month | 2.61% / 0.82% / 15.54% |
| Trend / MA-cross | uptrend / golden |
| SMA20 / SMA50 | 3,145.25 / 3,122.02 |
| RSI (14) / Stochastic %K | 64.1 / 95.0 |
| Bollinger %B / ATR | 81% / 98.96 |
| Support / Resistance 20 days | 2,891.50 / 3,344.00 |
| Data as of | 29 Juli 2026 14:00 WIB |