Golden Cross Formed, Singtel Stock Gains 1.10% Today
On Juli 31, 2026: price 4.58 SGD, trend uptrend, RSI 66.7, support 4.37, resistance 4.61. technical analysis of singtel stock. Golden Cross Formed — full…

Singtel rose to SGD 4.58 on SGX on 29 July 2026, extending a short-term advance that has carried the stock above its near-term trend markers and back toward the top of its recent trading range. The move was modest in daily terms at 1.10%, but the signal matters more than the size: price is now trading with the trend rather than against it, and the chart shows a market that is being pulled higher by both price structure and participation.
Trend & Price Action
The first thing the chart shows is that Singtel is no longer sitting below its moving averages and hoping for a turn; it is now above both the SMA20 at 4.43 and the SMA50 at 4.41. That matters because moving averages are not just lines on a chart — when price holds above them, it usually means the market is accepting higher valuations rather than rejecting them.
The crossover is also constructive. A golden cross has formed, with the SMA20 moving above the SMA50, and the SMA20 slope is rising at 0.33% over 5 days. In plain English, the short-term trend is now stronger than the medium-term trend, which often signals that buyers have regained control after a period of consolidation.
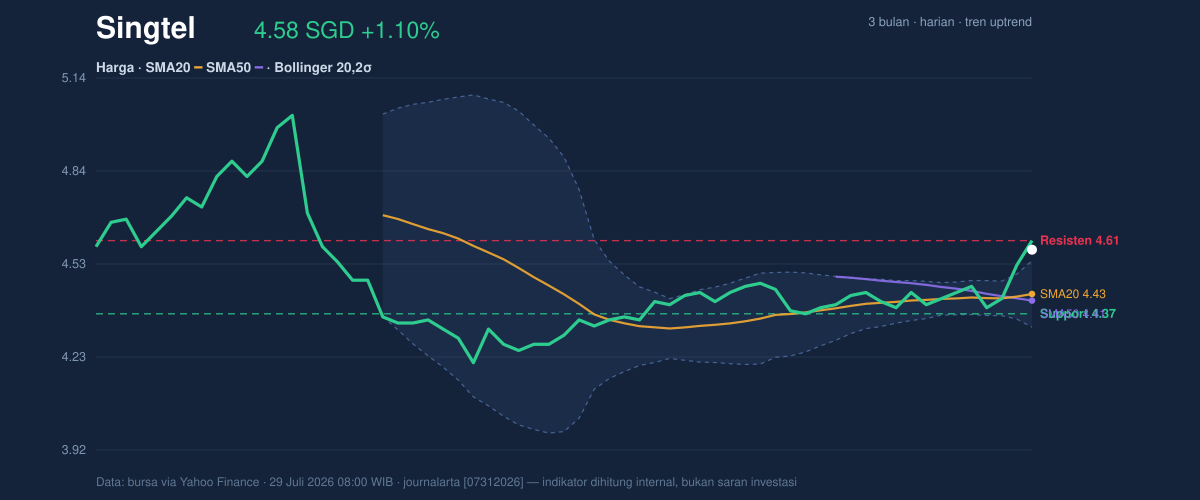
Price is also positioned near the upper edge of its recent band, with SGD 4.61 as the immediate resistance and SGD 4.37 as support. The stock is trading at about 87% of its range, which means it is closer to the ceiling than the floor. That is a bullish location, but it also means the market is asking whether there is enough follow-through to clear resistance rather than simply stall beneath it.
The broader three-month range helps frame the move. Singtel’s recent advance has taken it away from the 3-month low of 4.15, but it still sits below the 3-month high of 5.05. That gap suggests the stock has repaired its trend damage, though it has not yet fully reclaimed the upper part of its longer trading band.
Oscillators & Momentum
Momentum is supportive, but not perfectly clean. The RSI at 66.7 is still described as neutral, yet it is close enough to the upper zone to show that the stock is gaining traction without being deeply stretched. RSI is a pace gauge: readings near the upper end often mean buyers are active, but also that the move is becoming more mature.
The sharper warning comes from stochastic momentum. With %K at 100.0 and %D at 84.4, the stock is in overbought territory. That does not automatically mean reversal, but it does mean the latest burst of buying has been strong enough to push the price to the upper boundary of its recent momentum range. If the stock pauses here, this indicator would be one of the first signs that the rally is cooling rather than failing.
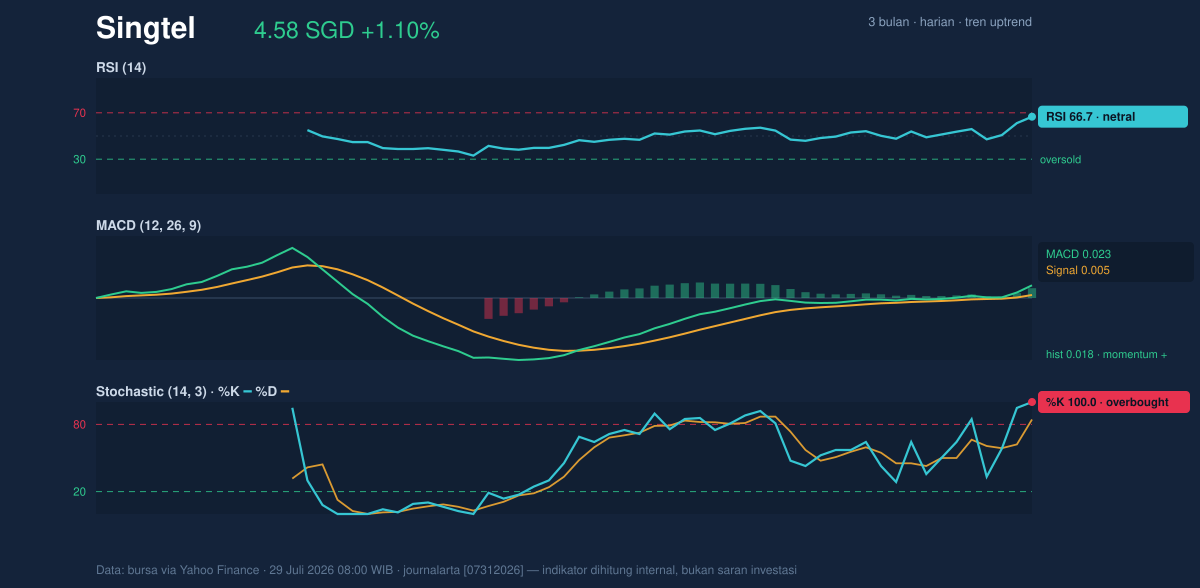
The MACD is positive at 0.023, above its signal line at 0.005, with a histogram of 0.018. That combination is important because MACD is not just saying the stock rose; it is saying the rise is still accelerating relative to its recent average. In other words, the trend is being confirmed by momentum rather than merely reflected by price.
Volatility & Volume
Volatility is not excessive, but it is compressing in a way that can matter. The Bollinger upper band is 4.54, the middle band is 4.43, and the lower band is 4.33. With price above the upper band and %B at 117%, the stock is trading beyond the usual statistical envelope. That often signals strength, but it can also indicate that the move has become extended in the short run.
More importantly, the Bollinger band width is 4.9% and is described as a squeeze. A squeeze means volatility has narrowed, which often precedes a larger directional move. When a squeeze happens alongside a golden cross and positive MACD, the market is effectively telling investors that a breakout attempt is not random; it is being built on a tightening base.
Volume supports that reading. The latest volume was 38,358,000, compared with a 20-day average of 29,311,870, or 1.3× normal. That is a useful confirmation because a breakout attempt is more credible when more shares are changing hands. The OBV is rising, which means volume has been accumulating in the same direction as price — a sign that the advance is being backed by participation rather than thin trading.
Key Levels & Scenarios
The market is now watching whether Singtel can turn resistance into support. The nearest ceiling is SGD 4.61, while the nearest floor is SGD 4.37. If price clears 4.61 on sustained volume, the chart would be confirming that the squeeze is resolving upward. If it fails there, the stock may drift back toward the middle band at 4.43, where the market would decide whether the breakout attempt has real depth.
The key point is that the stock is not in a weak trend waiting for rescue. It is in an improving trend that is now being tested at resistance, with momentum positive but somewhat stretched. That combination often produces either a clean continuation or a short pause, and the next session’s behavior around 4.61 will be the clearest clue.
Technical Verdict: HOLD (wait & see)
HOLD (wait & see)
- Golden cross and price above both the SMA20 at 4.43 and SMA50 at 4.41 support the trend.
- MACD remains positive and OBV is rising, which confirms participation behind the move.
- Stochastic is overbought and price is already near resistance at 4.61, so the setup is constructive but extended.
Verdict invalidated if price falls below 4.37.
- Ideal entry range: 4.43 to 4.61
- Exit target: 4.61 first, then the next test is the recent 3-month high at 5.05
- Stop loss protection: 4.37
For non-traders, this means the stock looks healthier than before, but it is now close enough to resistance that the market is waiting for proof before the next move.
Summary Data Singtel
| Last price | 4.58 SGD |
| Change 1 day / 5 days / 1 month | 1.10% / 3.15% / 3.15% |
| Trend / MA-cross | uptrend / golden |
| SMA20 / SMA50 | 4.43 / 4.41 |
| RSI (14) / Stochastic %K | 66.7 / 100.0 |
| Bollinger %B / ATR | 117% / 0.08 |
| Support / Resistance 20 days | 4.37 / 4.61 |
| Data as of | 29 Juli 2026 08:00 WIB |
