HSBC Stock Gains 1.54%, RSI Overbought In Focus
On Juli 31, 2026: price 164.50 HKD, trend uptrend, RSI 76.1, support 149.50, resistance 164.70. technical analysis of hsbc stock. HSBC Stock Gains — full…

At HKD 164.50, HSBC Holdings is pressing against the top of its recent range, with the share price sitting just under 20-hour resistance at HKD 164.70 and almost fully occupying the 99% end of the 20-hour range, according to exchange data cited by Yahoo Finance. The move is not happening in a vacuum: the stock is up 1.54% on the day, 3.52% over five days and 11.22% over one month, while the broader technical structure remains in an uptrend. That combination says the market is still rewarding HSBC’s recent advance, but it is also warning that the rally is now extended and vulnerable to a pause if momentum cools.
Trend & Price Action
The main signal in the chart is that price remains comfortably above both moving averages: HKD 164.50 is above the SMA20 at HKD 156.28 and the SMA50 at HKD 149.31, which usually indicates buyers still control the intermediate trend. The SMA20 is rising, with a 2.38% slope over five days, reinforcing that the trend is not just positive but gaining traction. There is no fresh MA-cross, so the chart is not flashing a new structural breakout or breakdown; instead, it is showing a trend that has already been established and is now being tested near the ceiling of its recent range. As shown in the chart, price is also near the upper Bollinger band at HKD 164.82, which often marks the area where momentum can stretch before mean reversion — a move back toward the middle band, not necessarily a trend reversal.
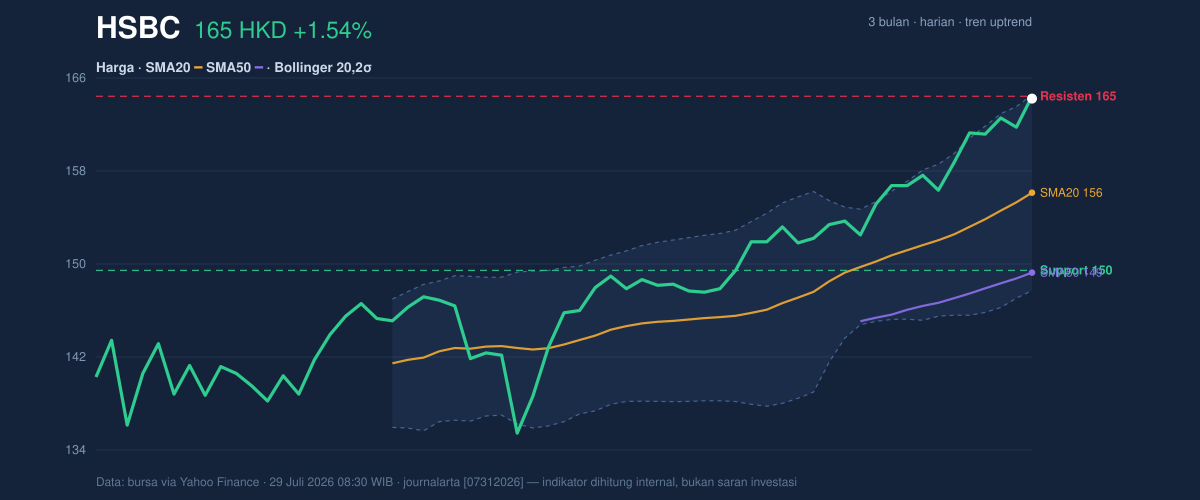
The key message is that HSBC is strong, but increasingly stretched.
Oscillators & Momentum
The momentum picture is where the caution starts to matter. RSI at 76.1 and Stochastic %K at 100.0 / %D at 95.1 both sit in overbought territory, meaning the stock has advanced so quickly that short-term traders may already be crowded on the same side of the trade. Overbought does not mean the share must fall immediately; in a strong trend, it can stay elevated for some time. But it does mean upside progress usually becomes harder to sustain without a pause, consolidation or a brief pullback. The MACD at 4.063, above its signal line at 3.476 with a 0.587 histogram, still points to positive momentum, so the trend has not rolled over. In plain terms: the chart is saying “still bullish,” while the oscillators are saying “already hot.”
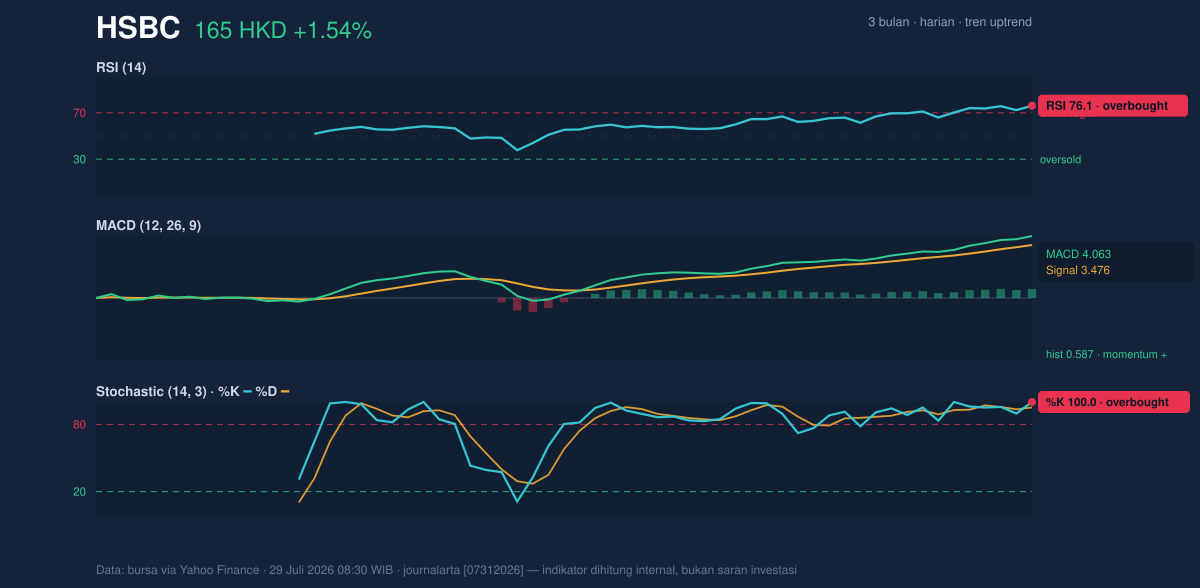
That split between strong trend and overbought momentum is the central tension in the chart.
Volatility & Volume
Volatility is not especially explosive right now, which matters because it suggests the price is advancing in an orderly way rather than in a panic-driven spike. The ATR(14) at 2.71, or 1.6% of price, indicates moderate volatility: enough room for meaningful intraday swings, but not enough to imply disorder. The Bollinger band width of 10.9% is described as normal, so the market is not in a squeeze that often precedes a sharp expansion. Instead, the stock is already near the top of its current envelope, with %B at 98% showing price is hugging the upper band. Volume adds confirmation: 20,520,250 shares traded versus a 20-hour average of 13,740,777, or about 1.5x normal, and OBV is rising. That matters because rising volume and rising on-balance volume suggest real participation rather than a thin move pushed by a few trades. In other words, the advance has buyers behind it.
Key Levels & Scenarios
The nearest technical floor is the 20-hour support at HKD 149.50, which also sits close to the SMA20 at HKD 156.28 and the Bollinger middle band at the same level. The immediate ceiling is HKD 164.70, with the 3-month high also at HKD 164.70. That alignment matters: a level that is both current resistance and a 3-month high is a genuine test of whether the market is willing to pay a new price for the stock. If HSBC can clear that zone decisively, the chart would shift from range pressure to price discovery. If it fails there, the most natural reaction would be a retreat toward the mid-band area around HKD 156.28, where the trend can be reassessed without breaking the broader uptrend. A deeper loss of HKD 149.50 would be more serious because it would take price back to the lower edge of the recent structure and below the SMA20, weakening the current bullish setup.
Technical Verdict: HOLD (wait & see)
HOLD (wait & see) because the chart is still trend-positive, but the short-term setup is stretched.
- RSI 76.1 and Stochastic %K 100.0 / %D 95.1 are overbought, which raises the odds of a pause or pullback.
- MACD 4.063 above signal 3.476 keeps the underlying momentum positive, so the trend has not broken.
- Price at HKD 164.50 is pressing into HKD 164.70 resistance and the upper Bollinger band at HKD 164.82, leaving limited room before the chart needs either a breakout or a reset.
Verdict invalidated if price falls below HKD 149.50, because that would break the nearest support and pull the stock back under the main short-term trend structure.
- Ideal entry range: HKD 156.28 to HKD 149.50
- Exit target: HKD 164.70 and, if that level gives way, a move into new high ground beyond the 3-month high at HKD 164.70
- Stop loss protection: below HKD 149.50
For non-traders, that means the stock still looks strong, but it is already near a point where momentum can pause before the next move.
HSBC’s 3-month high is HKD 164.70.
Summary Data HSBC
| Last price | 164.50 HKD |
| Change 1 day / 5 days / 1 month | 1.54% / 3.52% / 11.22% |
| Trend / MA-cross | uptrend / none |
| SMA20 / SMA50 | 156.28 / 149.31 |
| RSI (14) / Stochastic %K | 76.1 / 100.0 |
| Bollinger %B / ATR | 98% / 2.71 |
| Support / Resistance 20 days | 149.50 / 164.70 |
| Data as of | 29 Juli 2026 08:30 WIB |



