OCBC Stock Analysis: Gains 0.59%, RSI Overbought
On Juli 31, 2026: price 29.10 SGD, trend uptrend, RSI 78.3, support 25.08, resistance 29.78. technical analysis of ocbc stock. OCBC Stock Analysis — full…

OCBC Bank’s shares on SGX rose to SGD 29.10 as of 29 July 2026 08:00 WIB, edging above the previous close of 28.93 and extending a one-month climb of 18.00%. The stock is still in a clear uptrend, but the latest chart signals show a market that has run hard enough to invite caution: momentum remains positive, yet the short-term oscillators are flashing overbought conditions, as shown in the chart.
Trend & Price Action
The broader structure is constructive. OCBC is trading above both its SMA20 at SGD 27.87 and SMA50 at SGD 25.59, which means the price is holding above both its short- and medium-term trend lines. That positioning usually tells traders the market is being supported by buyers rather than merely bouncing on noise. The SMA20 slope of 4.08% over 5 days reinforces that message: the shorter trend is still rising, not flattening out.
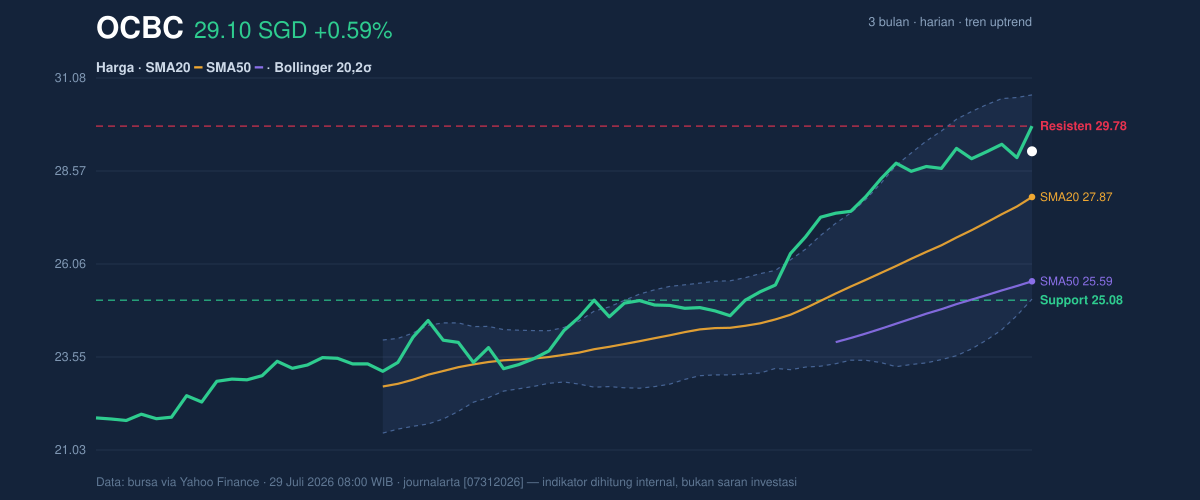
The stock is also sitting near the upper end of its recent band. With support at SGD 25.08 and resistance at SGD 29.78, the current price is already at 86% of the 20-hour range. In plain terms, OCBC is close to the top of the recent trading corridor, not the middle. That matters because stocks that spend a lot of time near resistance often need either a fresh wave of demand to break higher or a pause to digest gains first.
The 3-month range adds context. The latest price is just below the 3-month high of SGD 29.78 and well above the 3-month low of SGD 21.65. That is a strong relative position, but it also means much of the easy upside from the recent move has already been captured.
Oscillators & Momentum
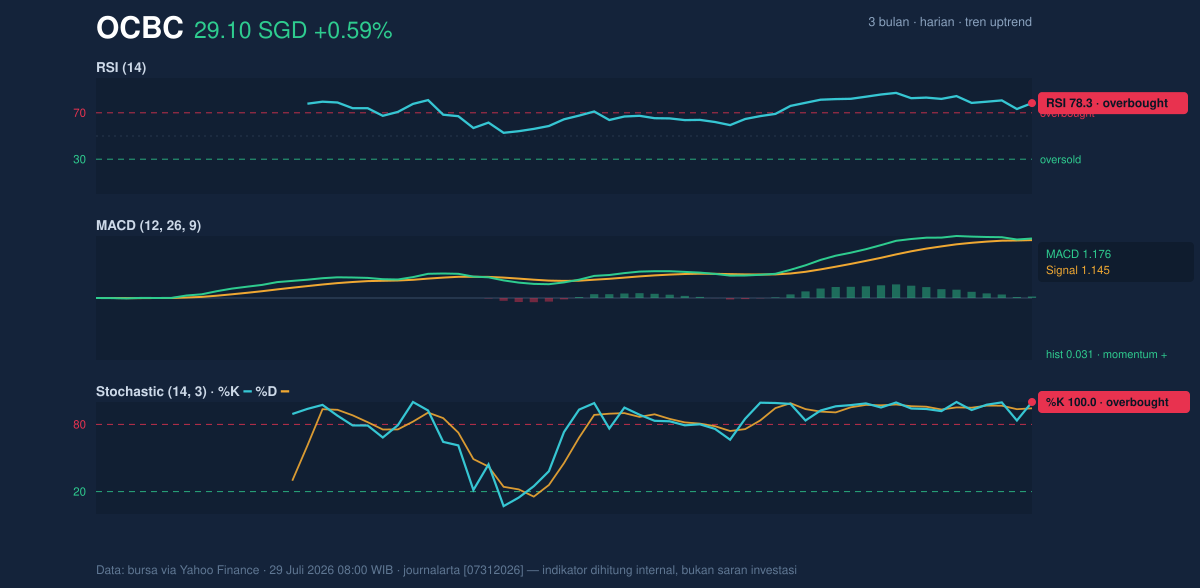
Momentum is still positive, but it is stretched. The RSI at 78.3 and Stochastic %K at 100.0 / %D at 94.4 both sit in overbought territory. For general readers, overbought does not mean a stock must fall immediately; it means recent buying has been intense enough that the market may be vulnerable to a breather if fresh buyers do not keep arriving. The message here is not weakness, but exhaustion risk.
That said, the MACD at 1.176 remains above its signal line at 1.145, with a positive histogram of 0.031. This is the cleaner confirmation in the setup. MACD is a trend-following tool, and when it stays above the signal line it suggests the underlying trend is still intact even if the pace of the rally is becoming more extended. In other words, momentum is still pointing upward, but the oscillators say the stock may be running ahead of itself in the very short term.
Volatility & Volume
The Bollinger Bands help explain why the share price feels stretched but not yet broken. OCBC is trading above the middle band, with %B at 72%, meaning the price is in the upper part of the envelope but not pressed flat against the top. The upper band at SGD 30.62 and lower band at SGD 25.11 frame the current move, while the 19.8% band width indicates normal volatility rather than a squeeze. That is important: the market is not coiled for an explosive breakout purely from band compression, so any extension higher would need real follow-through rather than just a technical spring.
ATR adds a similar message. At 0.56, or 1.9% of price, volatility is moderate. This is not a chaotic tape, which reduces the odds of a violent one-day reversal, but it also means the stock may need time rather than urgency to work through its overbought condition.
Volume is supportive, though not dramatic. Last traded volume of 6,038,900 was close to the 20-hour average of 6,333,450, or about 1.0× normal. That suggests the advance is not being powered by a sudden speculative burst, but by steady participation. The OBV is rising, which is a positive sign because it means volume has generally been accumulating alongside price rather than fading behind it.
Key Levels & Scenarios
The market’s immediate test is whether OCBC can stay above the recent ceiling. Resistance at SGD 29.78 is the obvious line to watch, because that is also the 3-month high. A clean move above it would indicate the stock is entering price discovery rather than merely revisiting a prior peak. If that level fails to give way, the price may continue to oscillate below resistance while momentum cools.
On the downside, SGD 27.87 is the first technical reference because it is the SMA20 and the Bollinger middle band. A pullback to that area would not automatically damage the trend; it would more likely signal a normal reset inside an uptrend. The deeper line is SGD 25.11 at the lower Bollinger band, with SGD 25.08 as nearby support. A move through that zone would suggest the recent rally has lost traction and that the market is no longer respecting the short-term trend structure.
Technical Verdict: HOLD (wait & see)
The setup is still bullish in trend terms, but the indicators do not look clean enough for a fresh momentum chase. The verdict is HOLD (wait & see) because:
- Price is above the SMA20 and SMA50, confirming the uptrend remains intact.
- RSI 78.3 and Stochastic 100.0/94.4 show the stock is overbought and vulnerable to a pause.
- MACD remains positive, so the trend has not rolled over yet.
Verdict invalidated if price breaks below SGD 25.08, which would damage the recent support structure and the Bollinger lower-band floor.
- Ideal Entry Range: SGD 27.87 to SGD 25.11
- Exit Target (Target Price): SGD 29.78 to SGD 30.62
- Stop Loss Protection: Below SGD 25.08
For non-traders, this means OCBC still looks technically healthy, but the stock is already near a crowded part of the chart and may need a pause before the next move.
Summary Data OCBC
| Last price | 29.10 SGD |
| Change 1 day / 5 days / 1 month | 0.59% / -0.27% / 18.00% |
| Trend / MA-cross | uptrend / none |
| SMA20 / SMA50 | 27.87 / 25.59 |
| RSI (14) / Stochastic %K | 78.3 / 100.0 |
| Bollinger %B / ATR | 72% / 0.56 |
| Support / Resistance 20 days | 25.08 / 29.78 |
| Data as of | 29 Juli 2026 08:00 WIB |



