ORCL Stock Technicals Today: Gains 8.34%, Momentum Gains
On Juli 31, 2026: price 127.56 USD, trend downtrend, RSI 42.1, support 114.99, resistance 144.22. technical analysis of orcl stock. ORCL Stock Technicals —…

Oracle is trading in a market that is trying to stabilize after a sharp reset: the shares jumped to 127.56 USD on the New York Stock Exchange, but the broader chart still says the recovery is happening inside a larger downtrend.
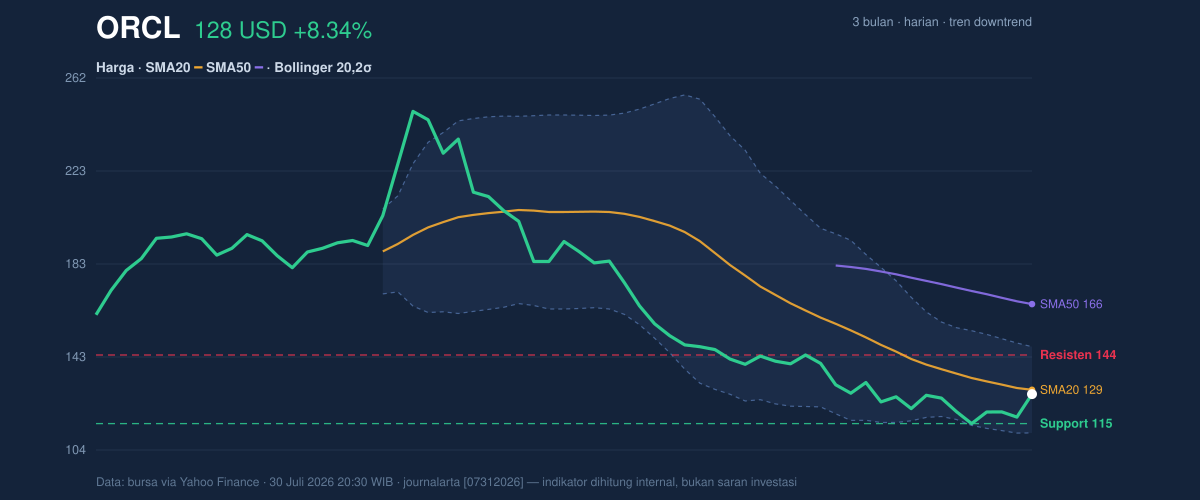
Oracle’s latest move is striking because it came after a weaker month. The stock rose 8.34% in one day and 6.26% over five days, yet it remains 10.48% lower over one month. That combination matters: a strong short burst inside a falling intermediate trend often reflects bargain-hunting or short covering, not necessarily a full trend reversal. The price is still below the SMA20 at 129.40 and far under the SMA50 at 165.95, which means the shares have not yet reclaimed the shorter-term average that often acts like a line of control for traders. As shown in the chart, Oracle is sitting in the lower half of its recent range, but not at the bottom of it.
Trend & Price Action
The chart structure remains cautious. Oracle is in a downtrend, and the SMA20 slope of -5.05% over five days shows that the short-term average is still falling rather than flattening out. In plain terms, the market is not yet saying “new uptrend”; it is saying “the decline has slowed enough for a rebound attempt.” The absence of a new MA-cross also matters: a moving-average cross is often used to confirm a change in trend, and without one, the latest bounce has less technical authority.
The price is trading at 43% of the 20-hour range between 114.99 support and 144.22 resistance. That places Oracle above the floor, but well below the ceiling. The broader three-month range is even more dramatic, with a 3-month high of 250.25 and a 3-month low of 114.50. The stock is still operating close to the lower end of that band, which tells readers that the market has not rebuilt the kind of confidence that would usually accompany a durable recovery.
A short rebound is not the same thing as a repaired chart.
Oscillators & Momentum
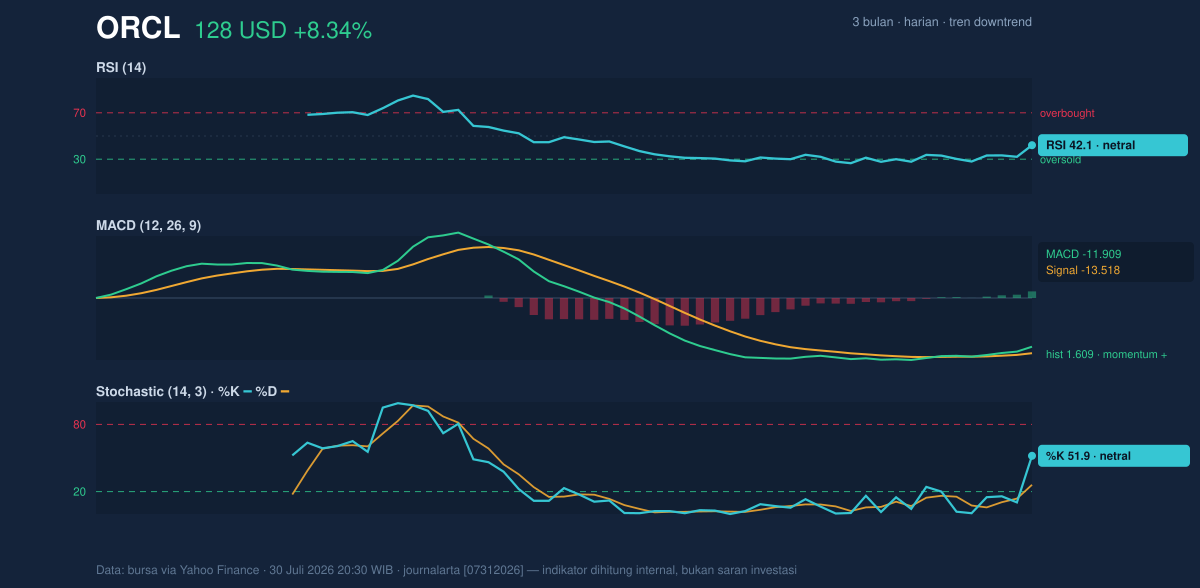
The momentum picture is mixed, and that is the key story. Oracle’s RSI at 42.1 is neutral but leaning weak: RSI is a gauge of whether recent gains or losses have been stretched, and a reading below 50 usually suggests sellers still have the edge, even if they are less aggressive than before. The Stochastic %K at 51.9 and %D at 26.0 are also neutral, but the gap between them hints at a recent lift in short-term price pressure. Stochastic compares the current close with the recent range; when it rises from a low base, it can signal a bounce, but not necessarily a confirmed trend change.
The more constructive element is the MACD at -11.909 versus the signal line at -13.518, with a positive histogram of 1.609. MACD measures whether near-term momentum is improving or deteriorating. Even though both lines are still below zero, the histogram being positive means the gap is narrowing in a bullish direction. In simple terms, downside momentum is easing. That does not erase the downtrend, but it does explain why the stock could rally sharply even while the wider structure remains fragile.
This is a recovery in momentum, not yet a recovery in trend.
Volatility & Volume
Oracle is moving in a noisy market. The Bollinger Bands are wide, with the upper band at 147.79, the middle at 129.40, and the lower at 111.01. A 28.4% band width indicates expansion, not compression, which usually means the market expects larger price swings rather than calm trading. The %B at 45% shows the share price sitting below the middle band, so it has not yet reclaimed the center of the volatility envelope. That is important because the middle band often behaves like a short-term balance point.
The ATR(14) of 7.04, equal to 5.5% of price, confirms that daily movement is elevated. ATR is a measure of typical range, so a high reading means traders should expect wider intraday swings and less stability around levels. Volume adds a small but useful confirmation: 41,094,800 shares traded versus a 20-day average of 39,100,210, or 1.1x normal, while OBV is rising. OBV, or on-balance volume, tracks whether volume is flowing into up days or down days; a rising line suggests buyers are participating enough to nudge the balance in their favor. That supports the bounce, even if it does not yet prove a full trend change.
Key Levels & Scenarios
The immediate map is clear. The first important floor is 114.99 support, which sits just above the 3-month low of 114.50. If Oracle fails to hold that area, the chart would lose one of its most visible defenses. On the upside, the first barrier is 129.40, the SMA20 and Bollinger middle band, followed by 144.22 resistance and then the 147.79 upper Bollinger band. A move through the middle band would matter because it would show the stock is recovering the average price traders have been using to anchor the recent move. A push toward resistance would suggest the rebound is gaining enough strength to test whether the market is willing to re-rate the shares after the recent slump.
Technical Verdict: HOLD (wait & see)
HOLD (wait & see)
- MACD histogram is positive, showing improving momentum, but the line remains below zero, so the trend has not fully turned.
- RSI at 42.1 and Stochastic in neutral territory suggest the stock has room to recover, but not enough confirmation to call the move durable.
- Price is still below the SMA20 at 129.40 and the broader trend is still down, so the rebound needs proof.
Verdict invalidated if price falls below 114.99.
- Ideal entry range: 114.99 to 129.40
- Exit target: 144.22 to 147.79
- Stop loss protection: below 114.99
For non-traders: Oracle is bouncing, but the chart still needs to show it can hold the floor and climb back above the short-term average before the move looks more trustworthy.
“Until the stock can reclaim its average price, this remains a rally that needs proof.”
Summary Data ORCL
| Last price | 127.56 USD |
| Change 1 day / 5 days / 1 month | 8.34% / 6.26% / -10.48% |
| Trend / MA-cross | downtrend / none |
| SMA20 / SMA50 | 129.40 / 165.95 |
| RSI (14) / Stochastic %K | 42.1 / 51.9 |
| Bollinger %B / ATR | 45% / 7.04 |
| Support / Resistance 20 days | 114.99 / 144.22 |
| Data as of | 30 Juli 2026 20:30 WIB |


