79.65 HKD is pressing against the upper Bollinger band at 79.67, and that matters because it shows AIA Group’s latest move is not just a mild rebound but a test of the current ceiling. The stock rose 2.25% in the latest session, extending a 3.58% gain over five days and an 11.48% advance over one month, according to HKEX-linked market data via Yahoo Finance. Yet the pattern is still described as sideways, which is the important signal: the shares are improving inside a range, not yet breaking into a clean new trend.
Trend & Price Action
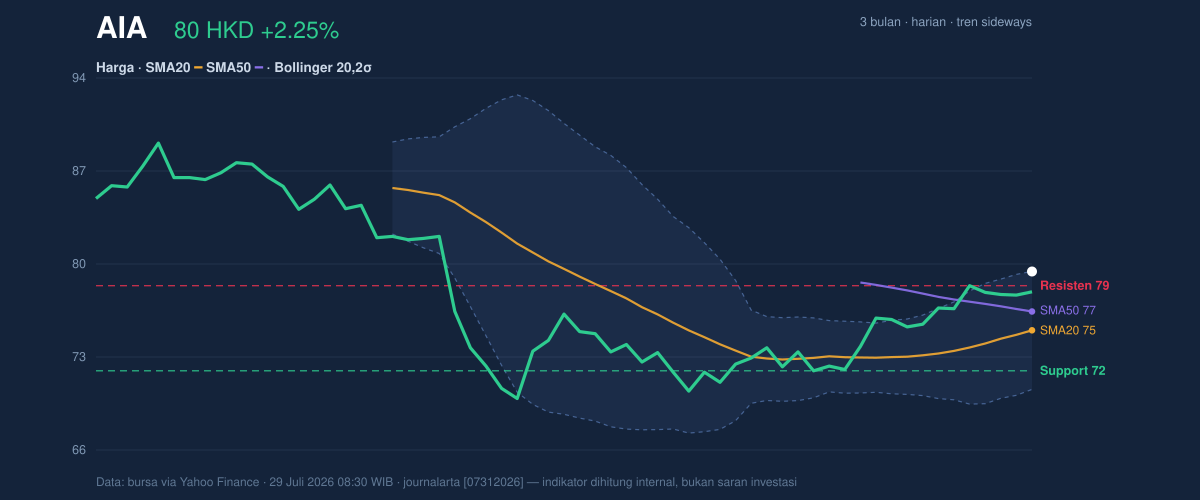
The chart shows price trading above the SMA20 at 75.30 and also above the SMA50 at 76.69, a constructive setup that usually means recent buying has been strong enough to lift the stock above both its short- and medium-term averages. But there is no new MA-cross, so the move has not yet earned the kind of trend confirmation that comes with a fresh crossover. In plain language, the stock is leaning upward, but the market has not fully endorsed a new directional phase.
That is reinforced by the Bollinger structure. With the upper band at 79.67, the middle band at 75.30, and the lower band at 70.93, AIA is sitting right at the top of its recent statistical range. The %B reading of 100% means the price is at the upper edge of the band system, which often signals strong short-term momentum but also leaves less room for immediate extension without a pause. The band width of 11.6% is still normal, so this is not a volatility breakout yet; it is more a controlled push toward resistance.
3-month price action chart of AIA: price, SMA20/50, Bollinger, support & resistance. Data: exchange via Yahoo Finance.
The most relevant near-term levels come from the 20-hour range: support at 72.30 and resistance at 78.60. With the stock now at 117% of the range, price is trading above the stated resistance zone, which explains why the chart looks stretched. That does not automatically imply reversal, but it does mean fresh upside would need follow-through rather than just momentum from the prior session.
Oscillators & Momentum
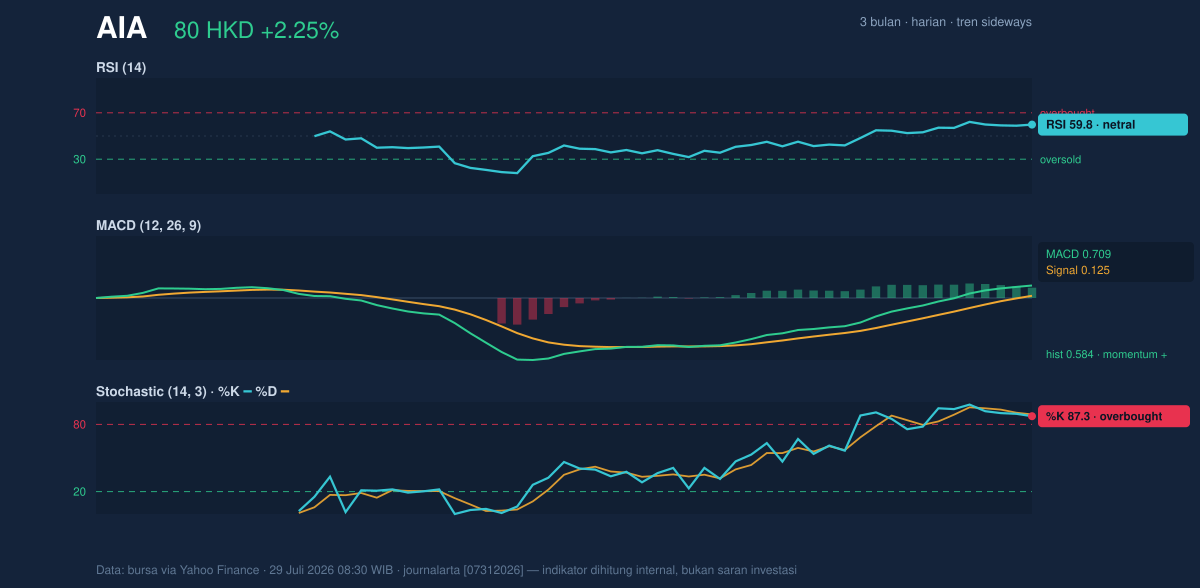
Momentum chart of AIA: RSI(14), MACD, Stochastic. Data: exchange via Yahoo Finance.
Momentum indicators are mixed in a way that often appears near short-term peaks. The RSI at 59.8 is still neutral, which says the stock is not broadly overextended yet. But the Stochastic %K at 87.3 and %D at 88.9 are both overbought, and that is the sharper near-term warning. Stochastic tends to react quickly to price acceleration, so readings this high often mean the stock has moved close to the top of its recent range and may need either consolidation or a pullback before it can advance cleanly again.
The MACD at 0.709, with the signal line at 0.125 and histogram at 0.584, remains positive. That is the clearest bullish element in the setup. MACD measures whether short-term momentum is outrunning longer-term momentum, and a positive histogram means that advantage still exists. In other words, the stock has upside energy, but the faster oscillators are already warning that the pace may be running ahead of itself.
Volatility & Volume
Volatility is not unusually high. The ATR(14) of 1.96, equal to 2.5% of price, points to moderate volatility. That matters because the stock is not moving in a disorderly fashion; instead, it is advancing within a relatively contained daily swing. When ATR is moderate and Bollinger width is normal, price often needs either stronger participation or a catalyst to escape the range decisively.
Participation, however, is softer than the price action suggests. Last volume was 14,512,593, below the 20-hour average of 22,991,972, or about 0.6× normal. That is a caution flag. A move to the top of the range on lighter turnover can indicate that buyers are present, but not yet fully committed. The OBV is down, which adds another layer of hesitation because OBV tracks whether volume is supporting price. When price rises but OBV falls, the rally can be more fragile than it first appears. The chart is showing progress, but not broad participation.
Key Levels & Scenarios
The immediate technical picture is straightforward: 78.60 is the nearest resistance reference, while 72.30 is the key support level to watch. The broader range over the past three months extends from 69.05 to 89.95, placing the current price in the upper half of that span but still below the upper extreme. That positioning is important because it shows improvement without yet reaching the prior peak zone.
If price holds above 78.60 and volume improves from the current 0.6× normal, the chart would start to look less like a range test and more like a continuation attempt. If it fails to hold above that area, the overbought Stochastic readings suggest a retreat toward the mid-band around 75.30 could develop quickly. A break below 72.30 would weaken the current structure and shift attention back toward the lower Bollinger band at 70.93.
Technical Verdict: HOLD (wait & see)
HOLD (wait & see)
- Reason 1: Price is above SMA20 and SMA50, which is constructive, but there is no new MA-cross to confirm a fresh trend.
- Reason 2:MACD is positive, supporting momentum, while Stochastic is overbought, warning that the short-term move may be stretched.
- Reason 3: Price is pressing the upper Bollinger band at 79.67 with %B at 100%, but volume is only 0.6× normal and OBV is down, so participation is not yet convincing.
- Verdict invalidated if price breaks below 72.30, because that would mean the current range support has failed.
- Ideal Entry Range:75.30 to 76.69
- Exit Target:78.60 to 79.67
- Stop Loss protection:72.30
In plain English, the stock is improving, but the chart is still asking for proof that the breakout can hold.