UOB Stock Gains 1.72% Today, Momentum Weakens
On Juli 31, 2026: price 43.88 SGD, trend uptrend, RSI 65.2, support 40.07, resistance 44.95. technical analysis of uob stock. UOB Stock Gains — full details…

United Overseas Bank rose to SGD 43.88 on SGX in Singapore, up from the previous close of 43.14, as the lender extended a medium-term uptrend that has already carried the share price 10.67% higher over one month. The move keeps UOB above both its SMA20 at 42.96 and SMA50 at 40.38, a positioning that usually signals buyers still control the broader trend even if the latest momentum is not fully aligned.
Trend & Price Action
The chart shows UOB trading in the upper half of its recent range, with price sitting at about 78% of the 20-hour range between support at 40.07 and resistance at 44.95. That matters because it suggests the market has already done much of the work needed to recover from the lower end of the band, but it has not yet cleanly broken through the ceiling that has capped the recent advance. The stock is also below the 3-month high of 45.15, so the next stretch of strength would be measured against that prior peak rather than against a fresh breakout.
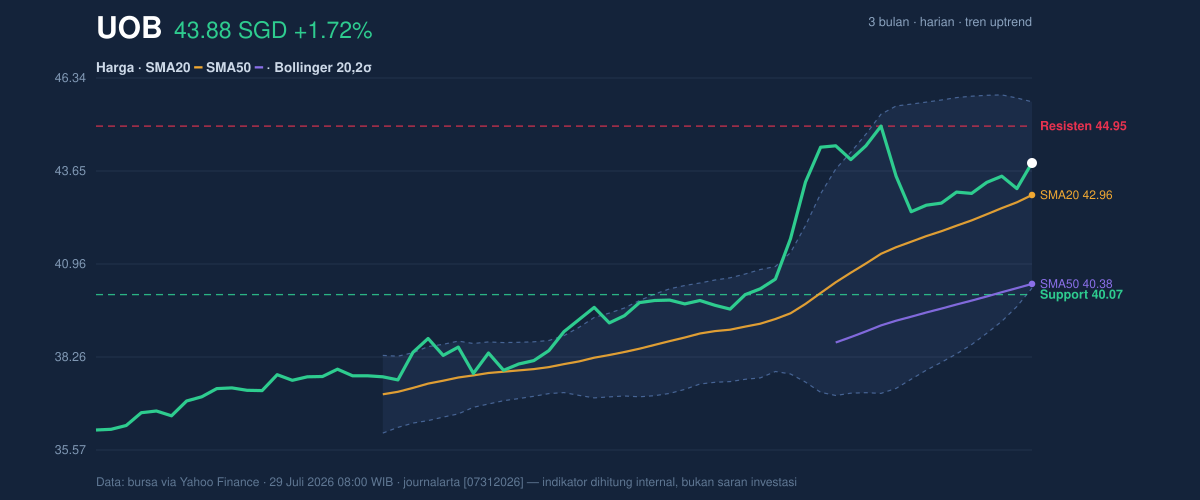
The broader structure remains constructive because the SMA20 is rising at 2.12% over five days. In plain language, that slope means the short-term average itself is moving higher, which often confirms that recent gains are not just a one-day spike. There is no new MA-cross, however, so the chart lacks the extra signal that would come from a fresh short-term average crossing above a longer-term one. That keeps the trend positive, but not emphatically so.
Oscillators & Momentum
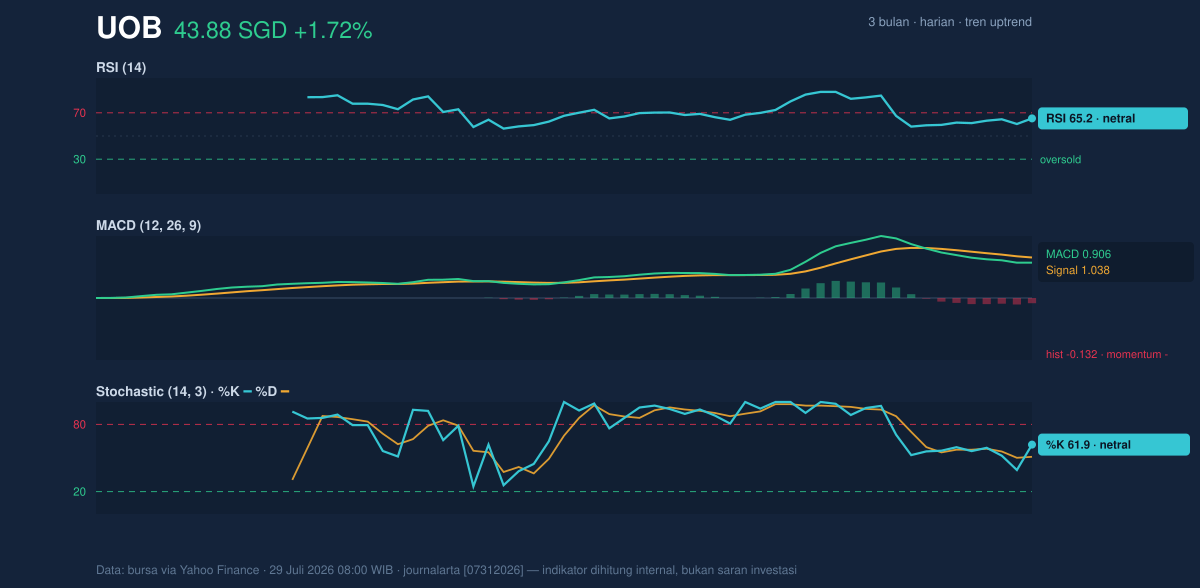
Momentum indicators are sending a more cautious message than the price trend. RSI at 65.2 sits in neutral territory, but close enough to the upper end to show the stock has already absorbed a fair amount of buying pressure. Stochastic %K at 61.9 and %D at 51.1 are also neutral, which means the share is not stretched enough to call overbought, yet it is no longer in the early phase of a rebound either. In practical terms, the oscillators say UOB still has room to move, but the pace of the move is no longer accelerating.
The most notable divergence comes from MACD at 0.906, which remains positive in absolute terms but is still below the signal line at 1.038, leaving a -0.132 histogram. That negative histogram is important because it shows short-term momentum has slipped under the trend signal even while price remains elevated. When price is rising but MACD momentum is fading, the market is often pausing, digesting gains, or preparing for a tighter trading range rather than launching immediately higher.
Volatility & Volume
Volatility is contained rather than explosive. ATR at 0.88, or about 2.0% of price, points to a session environment where moves can still be meaningful, but not disorderly. The Bollinger Bands reinforce that picture: the band width is 12.6%, described as normal, with price at %B 67%. That reading means UOB is trading above the middle band at 42.96 and closer to the upper band at 45.65 than to the lower band at 40.26, but not pressed right against resistance. As shown in the chart, this is the kind of setup that often precedes either a controlled continuation or a sideways consolidation, depending on whether volume expands.
Volume did not confirm the latest lift. 2,944,900 shares changed hands, below the 20-hour average of 3,591,743, or roughly 0.8× normal. That matters because a move on lighter participation can reflect cautious accumulation rather than broad conviction. The OBV is falling, which means volume flow has not been keeping pace with price. In technical terms, the market is advancing, but the balance of traded shares has not yet fully endorsed the advance.
Key Levels & Scenarios
The nearest line in the sand is the 44.95 resistance. A clean move through that level would bring the 45.15 three-month high back into view and would suggest the recent uptrend is attempting to reassert itself with more force. If UOB fails there, the chart still has a cushion at the 42.96 SMA20, which now acts as a short-term pivot. A loss of that area would weaken the current structure and increase the chance of a drift back toward the 40.26 Bollinger lower band and the 40.07 support zone.
The key message is that price is still above the main trend anchors, but momentum and participation are less convincing than the headline gain suggests. That combination often produces a market that looks strong on the surface while quietly waiting for either a catalyst or a pullback to reset indicators. The core signal is a constructive trend with fading internal momentum, so the next move depends on whether UOB can clear resistance with stronger volume or slips back toward its short-term average.
Technical Verdict: HOLD (wait & see)
HOLD (wait & see)
- Reason 1: Price remains above both the SMA20 at 42.96 and SMA50 at 40.38, which preserves the uptrend.
- Reason 2: MACD is below its signal line and the histogram is negative, showing momentum is softer than the price action.
- Reason 3: Volume is only 0.8× normal and OBV is falling, so participation is not confirming the rise.
- Verdict invalidated if price breaks below 42.96, because that would put the short-term trend anchor at risk.
- Ideal entry range: 42.96 to 40.38
- Exit target: 44.95 to 45.15
- Stop loss protection: 40.26 to 40.07
In plain English, UOB still looks healthy on the chart, but the latest rise is not yet backed by enough momentum and volume to make the next leg obvious.
Summary Data UOB
| Last price | 43.88 SGD |
| Change 1 day / 5 days / 1 month | 1.72% / 1.95% / 10.67% |
| Trend / MA-cross | uptrend / none |
| SMA20 / SMA50 | 42.96 / 40.38 |
| RSI (14) / Stochastic %K | 65.2 / 61.9 |
| Bollinger %B / ATR | 67% / 0.88 |
| Support / Resistance 20 days | 40.07 / 44.95 |
| Data as of | 29 Juli 2026 08:00 WIB |
