AIA Testing Key Resistance: Stock Drops 0.50% (Agustus 3, 2026)
On Agustus 3, 2026: price 79.25 HKD, trend sideways, RSI 62.6, support 72.30, resistance 79.65. technical analysis of aia stock. AIA Testing Key Resistance —…

AIA Group’s shares edged down to 79.25 HKD on HKEX, slipping 0.50% from the previous close of 79.65, even as the stock has risen 8.19% over the past month. The move leaves the insurer near the top of its recent trading band, with price sitting at 95% of the 20-hour range. That positioning matters: it shows the market has already done much of the near-term re-rating work, but it also means the next leg will need fresh confirmation rather than simple momentum carry.
Trend & Price Action
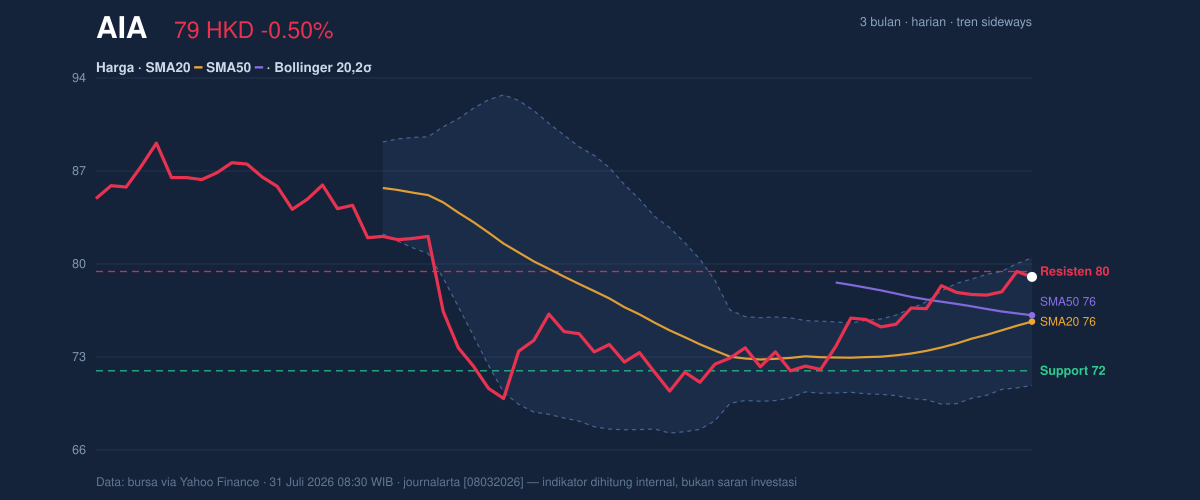
The broader setup is still described as sideways, which is a useful reminder that the stock is not in a clean, directional breakout trend. The SMA20 at 75.94 and SMA50 at 76.41 sit below the last price, so the shares are trading above both short- and medium-term averages. That is constructive, because price above both moving averages usually signals buyers remain willing to defend recent gains. But the lack of a new MA cross also suggests the trend has not yet developed the kind of clean alignment that often accompanies a sustained move.
The SMA20 slope of 2.18% over 5 days points upward, which confirms that the short-term trend is improving. At the same time, the market is approaching a sensitive area: the 20-hour resistance at 79.65 is just above the last price. As shown in the chart, the stock is trading in the upper part of its range rather than in a mid-range consolidation zone. That usually means upside follow-through can happen quickly if resistance gives way, but failure there can also trigger short-term profit-taking.
Oscillators & Momentum
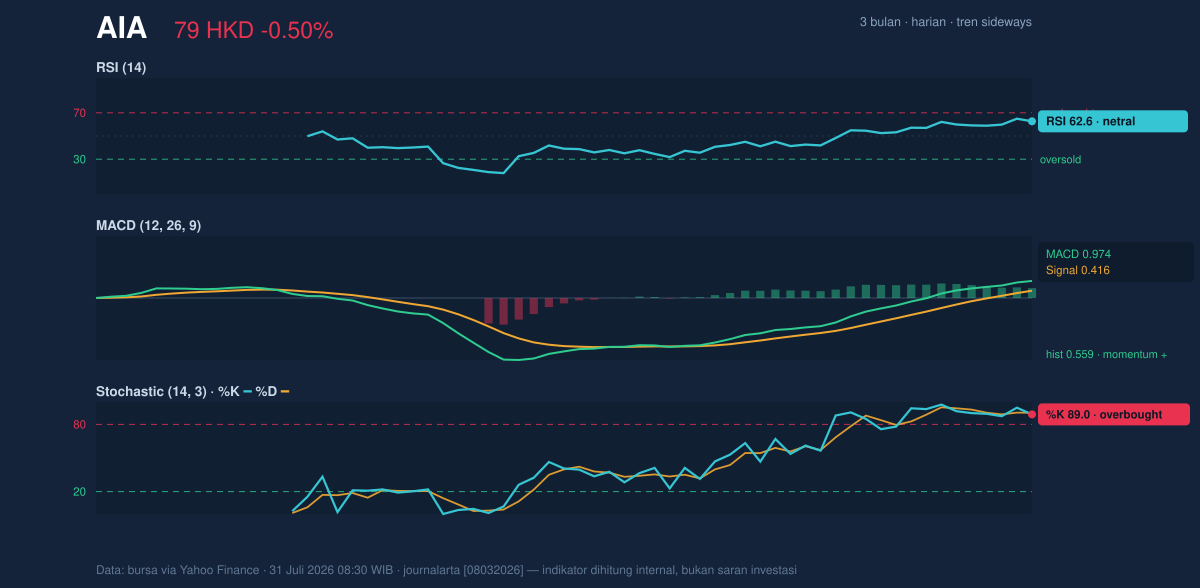
The momentum picture is mixed, and that is the key signal. The RSI at 62.6 is still in neutral territory, which means the stock is not yet in a stretched condition by RSI standards. That leaves room for further gains without immediate exhaustion. However, the Stochastic %K at 89.0 and %D at 90.4 are both in overbought territory, which tells a different story: the latest advance has been fast enough that short-term traders may already be crowded into the move.
That tension between RSI and Stochastic often matters. RSI is saying trend strength is present but not extreme; Stochastic is warning that the near-term pace may be too hot to sustain without a pause. The MACD at 0.974, above its signal line at 0.416 with a positive histogram of 0.559, still argues that the underlying momentum is positive. In plain English, the trend engine is still running, even if the timing oscillator is flashing caution.
Volatility & Volume
Volatility is not especially compressed. The Bollinger Band width of 12.4% is described as normal, and that matters because it suggests the stock is not sitting in a deep squeeze that would typically precede an explosive move. Instead, the market appears to be in a steady trading regime, where price can grind higher or reverse without the dramatic expansion usually seen after a long lull. The last price is also near the upper edge of the Bollinger structure, with %B at 85% and the upper band at 80.66. That placement says the stock is trading close to the top of its recent statistical range.
The ATR(14) at 1.88, or 2.4% of price, indicates moderate day-to-day movement. That is important because it frames how much noise to expect around support and resistance. A move of roughly this size can easily test nearby levels without necessarily changing the broader setup.
Volume adds a second layer of confirmation, but not a perfect one. Turnover of 27,134,663 was about 1.2× normal, so the latest move was not happening on thin participation. That is constructive. Yet the OBV is down, and that divergence matters because OBV, or on-balance volume, tries to infer whether volume is accumulating behind price gains. A falling OBV while price remains firm can mean the rally is not being backed by the broadest possible buying pressure, or that distribution is quietly offsetting demand. The message is not bearish by itself, but it does argue for caution around resistance.
Key Levels & Scenarios
The nearest levels are clear. 79.65 is the immediate resistance, while 72.30 is the key support from the 20-hour range. The broader 3-month frame gives context: the stock has traded between 89.95 and 69.05, so the current price is located in the upper-middle part of that historical band, not at an extreme.
If 79.65 is cleared and held, the chart would shift from a capped advance to a more convincing breakout attempt. If it fails to hold, the market may rotate back toward the moving-average area around 75.94 and 76.41, where prior buyers are likely to be tested. A loss of 72.30 would weaken the current structure materially, because that would place price back into a lower part of the recent range and undermine the short-term recovery.
Technical Verdict: HOLD (wait & see)
HOLD (wait & see)
- MACD is positive, so the underlying trend still has support.
- Stochastic is overbought, which raises the odds of a near-term pause or pullback.
- Price is pressing against resistance at 79.65 while OBV is down, so the move is not fully confirmed by volume.
Verdict invalidated if price breaks below 72.30.
- Ideal Entry Range: 75.94 to 76.41
- Exit Target: 80.66
- Stop Loss protection: 72.30
In plain English: the stock is still firm, but the chart wants proof before it can turn a short-term advance into something stronger.
The latest traded price remains 79.25 HKD.
Summary Data AIA
| Last price | 79.25 HKD |
| Change 1 day / 5 days / 1 month | -0.50% / 1.47% / 8.19% |
| Trend / MA-cross | sideways / none |
| SMA20 / SMA50 | 75.94 / 76.41 |
| RSI (14) / Stochastic %K | 62.6 / 89.0 |
| Bollinger %B / ATR | 85% / 1.88 |
| Support / Resistance 20 days | 72.30 / 79.65 |
| Data as of | 31 Juli 2026 08:30 WIB |


