DBS Stock Technicals Today: Drops 1.11%, Testing Key Resistance
On Agustus 3, 2026: price 74.02 SGD, trend uptrend, RSI 69.9, support 66.91, resistance 75.00. technical analysis of dbs stock. DBS Stock Technicals — full…

DBS Group’s shares slipped to 74.02 SGD on SGX, down 1.11% from the previous close of 74.85, even as the stock remains up 10.87% over one month. The move matters because it comes with the price still trading above its short- and medium-term averages, which tells investors the pullback is happening inside a broader upward structure rather than at the start of a clear reversal.
Trend & Price Action
The chart shows DBS still in an uptrend, with the SMA20 at 72.14 rising at 3.01% over five days and the share price holding above the SMA20 and well above the SMA50 at 67.44. That gap between the current price and the longer average is important: it suggests the market has already repriced DBS higher over the past several weeks, and the main question now is whether buyers can keep defending that higher base. There is no fresh MA-cross, so the trend is being carried by price staying above the moving averages rather than by a new technical trigger.
The stock is also sitting near the upper end of its recent range, with 74.02 SGD positioned at 88% of the 66.91 to 75.00 range and just below the 3-month high of 75.00. That is a constructive place to be in a rising market, but it also means upside is getting closer to a ceiling that has already capped the move.
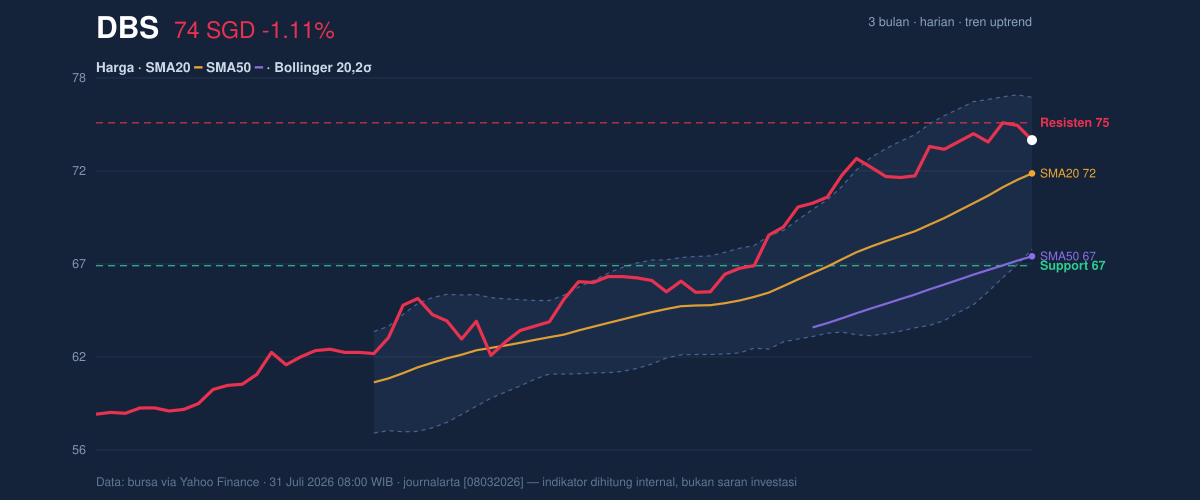
A small pullback here is not unusual. A break below the short-term average would matter more than the one-day drop itself.
Oscillators & Momentum
The momentum picture is more mixed than the trend picture. RSI(14) at 69.9 sits just under the usual overbought threshold, which means the stock is still strong but no longer cheap on a short-term basis. In plain language, the market has already done a lot of buying, so fresh demand has to work harder to push the share price higher from here. The Stochastic %K at 78.7 and %D at 92.0 also point to a stretched short-term setup, with %K below %D hinting that the recent surge may be losing some pace.
The clearest caution sign comes from MACD at 2.180 versus a signal line at 2.215, leaving a -0.035 histogram. That negative histogram means the trend is still positive, but near-term acceleration has slipped below its own average. In practical terms, the stock is not breaking down; it is simply no longer gaining speed as quickly as it was.
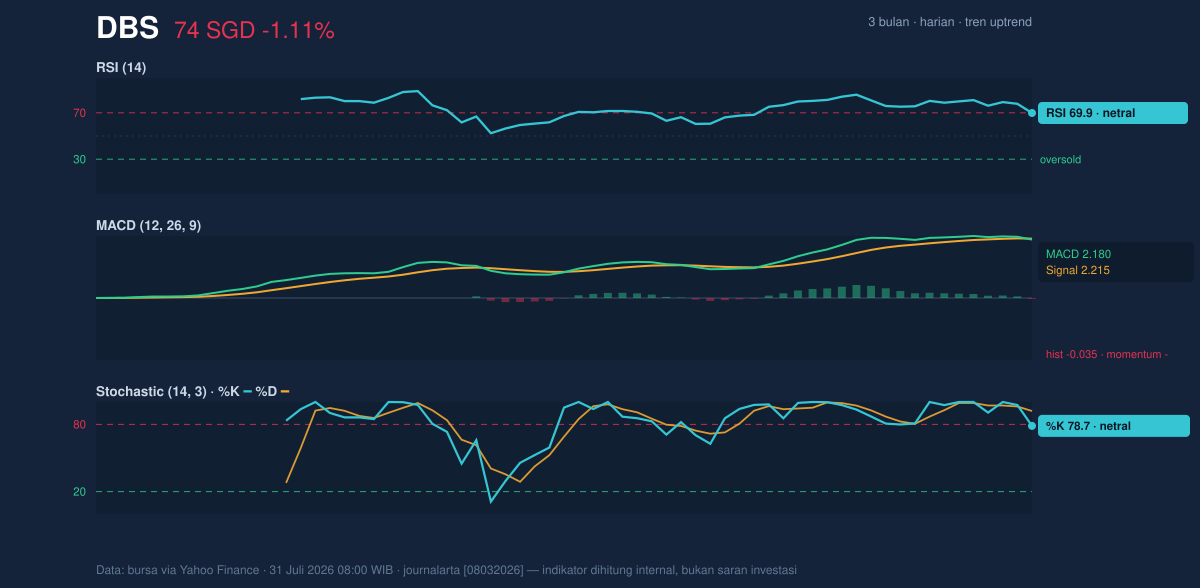
This is what a mature rally looks like: the trend is intact, but momentum is less enthusiastic.
Volatility & Volume
Bollinger Bands help frame where the price sits within its recent volatility envelope. DBS is trading at %B of 72%, which places it in the upper half of the band but not at the extreme top. The upper band at 76.44 is the nearest volatility-based resistance, while the middle band at 72.14 lines up with the SMA20 and acts as the first technical support zone. The 11.9% band width is described as normal, so this is not a squeeze setup that would typically warn of an imminent explosive move; instead, it suggests the stock is moving within a fairly standard trading envelope.
Volume adds a useful warning. The latest turnover of 5,296,900 is about 1.2× the 20-day average of 4,415,071, which shows participation is still present. But OBV is down, and that matters because on-balance volume is meant to track whether price gains are being confirmed by underlying accumulation. A falling OBV while price remains elevated often signals that the rally is being supported less by broad buying and more by selective demand. That does not confirm a top, but it does argue for caution near resistance.
The stock is still behaving better than a weak tape would suggest. The volume is there; the conviction is not as clean.
Key Levels & Scenarios
The immediate technical map is straightforward. 75.00 SGD is the key ceiling, matching both the 20-hour resistance and the 3-month high. A decisive move through that level would show DBS is not just drifting near its highs but actually extending beyond the recent range. On the downside, the first important floor is the 72.14 area, where the SMA20 and Bollinger middle band sit together. Below that, the broader support comes in at 67.83, the lower Bollinger band, with the 66.91 20-hour support marking the lower edge of the recent trading range.
If the stock fails to hold the 72.14 zone, the chart would start to look more like a consolidation than a clean continuation. If it loses 66.91, the current uptrend would be under much more serious pressure.
Technical Verdict: HOLD (wait & see)
HOLD (wait & see)
- RSI at 69.9 and Stochastic at 78.7 / 92.0 show the share is still strong, but short-term momentum is stretched.
- MACD at 2.180 below signal 2.215 with a -0.035 histogram suggests the rally has lost some near-term speed.
- Price above SMA20 at 72.14 and SMA50 at 67.44 keeps the broader trend positive, while 75.00 remains a clear ceiling.
- Verdict invalidated if price breaks below 72.14; that would weaken the short-term trend structure.
- Ideal Entry Range: 72.14 to 72.83
- Exit Target: 75.00 to 76.44
- Stop Loss protection: 67.83, with the deeper risk line at 66.91
For non-traders: DBS is still in an uptrend, but the stock is close to resistance and momentum is cooling, so the chart is asking for patience rather than urgency.
“The market is still paying up for DBS, but it is no longer doing so with the same conviction.”
Summary Data DBS
| Last price | 74.02 SGD |
| Change 1 day / 5 days / 1 month | -1.11% / 0.11% / 10.87% |
| Trend / MA-cross | uptrend / none |
| SMA20 / SMA50 | 72.14 / 67.44 |
| RSI (14) / Stochastic %K | 69.9 / 78.7 |
| Bollinger %B / ATR | 72% / 1.20 |
| Support / Resistance 20 days | 66.91 / 75.00 |
| Data as of | 31 Juli 2026 08:00 WIB |


