Golden Cross Formed, BP Stock Gains 1.77% Today
On Agustus 3, 2026: price 552.50 GBp, trend uptrend, RSI 63.1, support 467.80, resistance 555.90. technical analysis of bp stock. Golden Cross Formed — full…

BP plc is pressing against the top of its recent trading range, with the London-listed shares at 552.50 GBp after a 1.77% daily rise, but the chart is now sending a mixed message: trend strength is intact, while short-term momentum looks stretched.
The move matters because it shows the market is still rewarding BP’s recent upside, yet it is doing so from a high perch. As shown in the chart, the shares are trading above the SMA20 at 517.42 and above the SMA50 at 513.39, with a golden cross already in place. That crossover means the faster average has moved above the slower one, typically a sign that buyers have regained control after a weaker phase. The SMA20 slope of 3.73% over five days reinforces that the shorter trend is still pointing higher.
Trend & Price Action
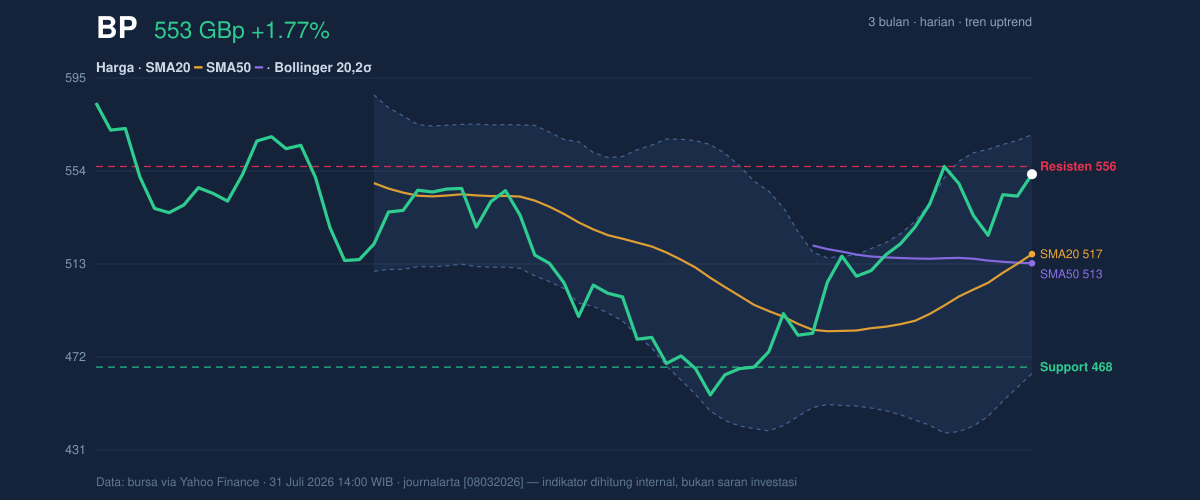
The price structure is constructive, but not without tension. BP is now sitting at 96% of its 20-hour range, with support at 467.80 and resistance at 555.90. That positioning tells readers the stock is trading very close to the upper boundary of its recent lane, which often means either a breakout attempt or a pause. The last price is also close to the top of the Bollinger envelope, where prices tend to become more sensitive to profit-taking.
That said, the broader three-month range still matters. BP has traded between 450.60 and 585.90 over that period, so the current level is not yet at an extreme. It is, however, well above the middle of that band, which suggests the market has shifted from defensive positioning toward a more optimistic stance.
The Bollinger setup adds nuance. The upper band at 569.87 is the next chart marker above the current price, while the band width of 20.3% shows volatility is expanding. Wider bands usually mean the market is no longer coiling quietly; it is prepared for larger swings. In practical terms, that makes BP’s current position more interesting, but also more fragile if momentum cools.
Oscillators & Momentum
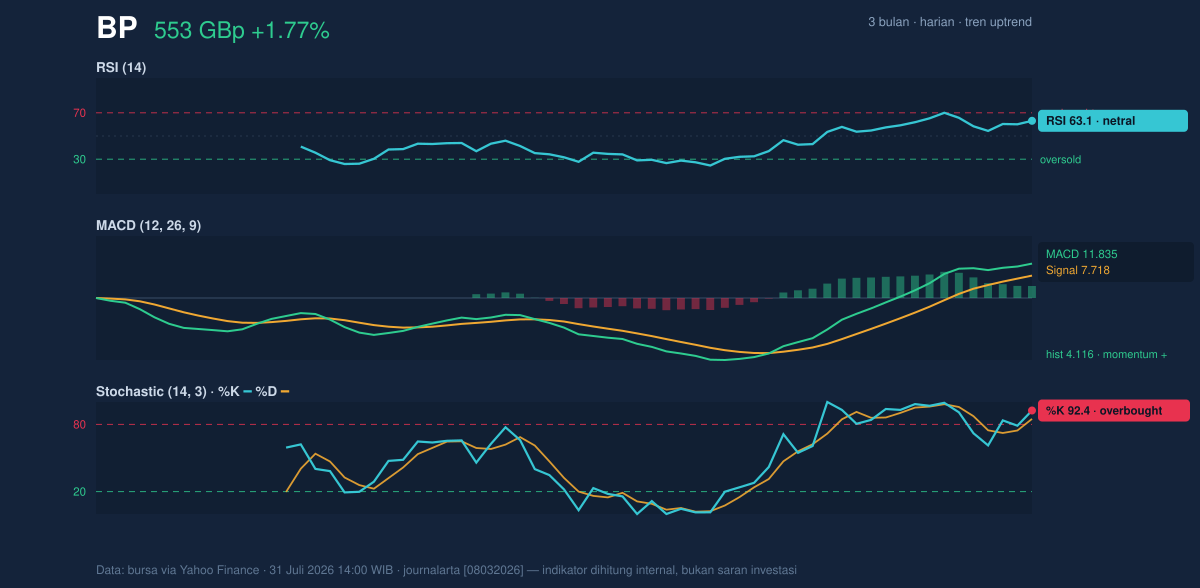
Momentum is positive, but not cleanly balanced. The RSI at 63.1 is still in neutral territory, which means the stock is not yet in a classic overbought warning zone. However, the Stochastic %K at 92.4 and %D at 84.9 are both elevated, and that is the sharper signal. Stochastic measures where the latest price sits within its recent range; readings this high usually mean the move has been fast enough that near-term buyers may already be crowded in.
The key point is that momentum and trend are not contradicting each other yet. The MACD at 11.835 remains above its signal line at 7.718, with a positive histogram of 4.116. In plain language, MACD is still confirming upward momentum rather than warning of reversal. So the setup is not weak; it is simply extended. When MACD stays positive while Stochastic is overbought, it often means the trend still has fuel, but the next few sessions may become choppier.
Volatility & Volume
Volume is doing enough to support the move, but not enough to call it emphatic. The latest trading volume of 37,026,346 is very close to the 20-hour average of 38,450,103, or roughly normal participation. That matters because price gains on ordinary volume can still be valid, but they do not carry the same conviction as a surge in turnover. The fact that OBV is rising is more encouraging: on-balance volume tracks whether trading pressure is accumulating over time, and a rising line suggests buyers have been consistently absorbing supply.
ATR at 14.11, equal to 2.6% of price, says daily movement is moderate rather than wild. Put together with the widening Bollinger bands, this points to a market that is capable of sharper intraday swings without being structurally chaotic. For readers, that means the stock can move quickly from here, but the move may still be orderly if the trend remains intact.
Key Levels & Scenarios
The chart leaves a clear decision point. Immediate resistance at 555.90 is now the first hurdle. If BP can clear that area decisively, the upper Bollinger band at 569.87 becomes the next reference point, and the market would be testing whether the recent rally can stretch toward the upper edge of its broader three-month range. If instead the shares fail to hold current levels, the first meaningful cushion is the SMA20 at 517.42, which also matches the Bollinger middle line. Below that, SMA50 at 513.39 becomes the next technical line of defence.
The most important signal here is not simply that BP is rising; it is that the stock is rising while momentum is already somewhat stretched. That combination often produces either a brief consolidation or a breakout attempt, depending on whether volume expands on the next push.
Technical Verdict: HOLD (wait & see)
HOLD (wait & see)
- MACD remains positive and above its signal line, which supports the uptrend.
- Price is above SMA20 and SMA50, with a golden cross confirming trend improvement.
- Stochastic is overbought and price is near resistance at 555.90, so upside momentum looks extended in the short term.
- Verdict invalidated if price breaks below 517.42.
- Ideal Entry Range: 517.42 to 522.00
- Exit Target: 555.90 to 569.87
- Stop Loss protection: 513.39 or, for wider room, 467.80
In plain English: BP’s chart still points higher, but the stock is close enough to resistance that the cleaner signal is to wait for either a breakout or a pullback.
Summary Data BP
| Last price | 552.50 GBp |
| Change 1 day / 5 days / 1 month | 1.77% / 0.75% / 18.27% |
| Trend / MA-cross | uptrend / golden |
| SMA20 / SMA50 | 517.42 / 513.39 |
| RSI (14) / Stochastic %K | 63.1 / 92.4 |
| Bollinger %B / ATR | 83% / 14.11 |
| Support / Resistance 20 days | 467.80 / 555.90 |
| Data as of | 31 Juli 2026 14:00 WIB |


