HSBC Stock Drops 0.69% Today, RSI Overbought
On Agustus 3, 2026: price 1,576.00 GBp, trend uptrend, RSI 70.4, support 1,453.40, resistance 1,587.00. technical analysis of hsbc stock.

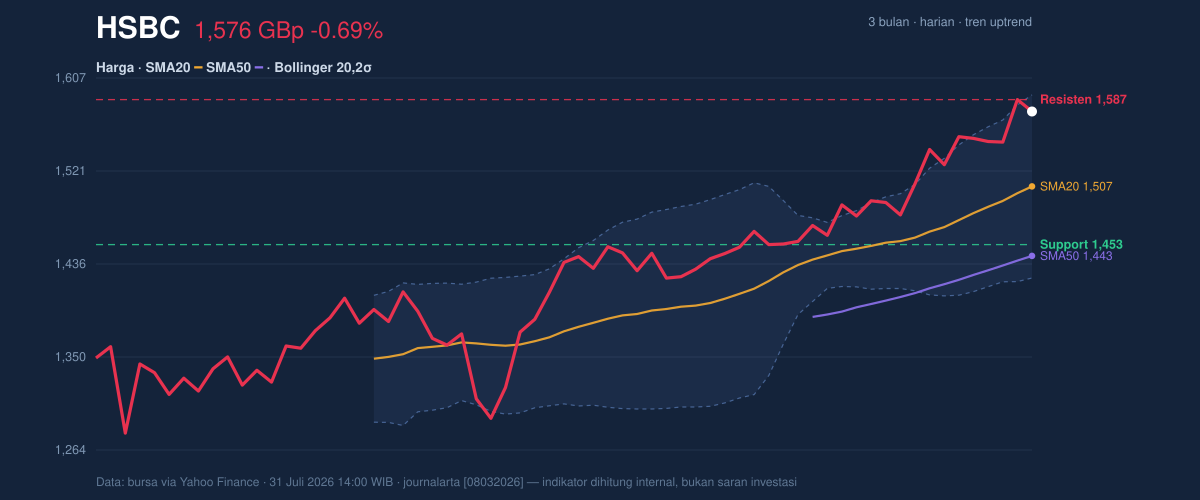
HSBC Holdings’ London-listed shares closed at 1,576.00 GBp, slipping 0.69% from the previous close of 1,587.00 even as the stock still sits 8.61% higher over the past month. That combination matters: the shares are still advancing in a clear uptrend, but they are now trading close to the top of their recent range, where momentum often becomes more selective and short-term profit-taking can appear. As shown in the chart, the price is holding above both major moving averages, yet the technical picture is starting to look stretched rather than fresh.
Trend & Price Action
The broader structure remains constructive. HSBC is trading above its SMA20 at 1,506.98 and well above the SMA50 at 1,443.04, which tells us the market is still rewarding buyers on both the short and medium time frame. The SMA20 is rising at 2.10% over 5 days, reinforcing that the trend is not just intact but still gaining slope. There is no new MA cross to point to, but the absence of a bearish crossover is itself important: it means the recent advance has not yet been undermined by a structural trend reversal.
The stock’s position within its range is the more nuanced signal. HSBC is sitting at 92% of the 20-hour range, with 20-hour support at 1,453.40 and 20-hour resistance at 1,587.00. That places the share price near the upper boundary of the recent trading band, which usually implies less room for immediate upside unless buyers can force a clean move through resistance. The three-month high at 1,604.60 is close enough to act as the next obvious reference point, while the three-month low at 1,256.20 shows how far the recovery has already run. The chart shows a stock in a strong uptrend, but one that is now pressing into a crowded ceiling.
Oscillators & Momentum
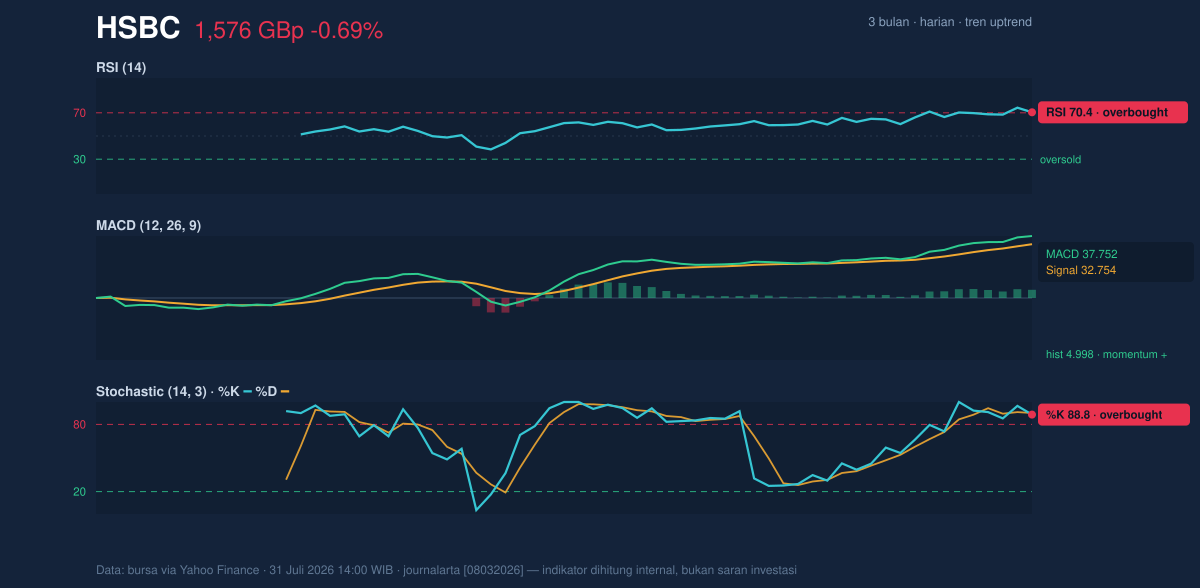
The momentum gauges are the clearest warning sign in an otherwise healthy trend. The RSI at 70.4 is in overbought territory, which does not mean the shares must fall, but it does mean the latest advance has become extended relative to recent trading. The Stochastic %K at 88.8 and %D at 90.2 are also overbought, suggesting the stock has been closing near the top of its recent intraday range for several sessions. In plain English, that is what strong demand looks like when it starts to mature: buyers are still in control, but the market is no longer cheap on a short-term basis.
That said, the trend has not yet rolled over. The MACD at 37.752 remains above the signal line at 32.754, with a positive histogram of 4.998. MACD is a momentum tool that compares shorter- and longer-term price movement; when it stays above the signal line, it usually indicates the trend is still being confirmed rather than fading. So the message from the oscillators is mixed but coherent: RSI and Stochastic are flashing overbought, while MACD is still confirming positive momentum. As shown in the chart, this is a classic late-stage strength setup — not a reversal signal yet, but a sign that follow-through may need fresh volume to continue.
Volatility & Volume
Volatility is moderate rather than explosive. The ATR at 39.69, equal to 2.5% of price, suggests normal day-to-day movement for a large-cap bank rather than a disorderly swing. Bollinger Bands reinforce that reading: the upper band is 1,591.29, the middle band is 1,506.98, and the lower band is 1,422.67. With %B at 91%, HSBC is trading very close to the upper band, which often indicates price is stretched toward the top of its volatility envelope. The band width of 11.2% is normal, so this is not a squeeze that usually precedes a sharp expansion; instead, it looks like a market already leaning upward inside a steady, established channel.
Volume offers only limited confirmation. Last volume was 20,240,565, almost identical to the 20-day average of 20,156,528, or 1.0x normal. That means the latest move is not being powered by a dramatic surge in participation; it is being sustained at ordinary turnover. More importantly, OBV is falling. On-balance volume tracks whether volume is flowing into or out of the stock, so a declining OBV while price remains elevated can hint at quieter distribution beneath the surface. In other words, the rally is still intact, but the crowd is not adding conviction at the same pace as price.
Key Levels & Scenarios
Near term, the market is pivoting around a narrow band. Resistance at 1,587.00 is the immediate hurdle, just below the upper Bollinger band at 1,591.29. A move through that zone would put the 3-month high at 1,604.60 back in play. On the downside, support at 1,453.40 sits well below the current price and also below the SMA20 at 1,506.98, which means a break there would be a more meaningful sign that the trend is losing altitude rather than just pausing.
For now, the technical picture favors a controlled advance over a breakout sprint. If HSBC can hold above the SMA20 at 1,506.98 while momentum cools from overbought levels, the stock could consolidate near the top of the range before deciding on its next direction. If it fails to hold that moving-average floor, the market would be signalling that the recent push toward the upper Bollinger band was driven more by short-term enthusiasm than durable demand.
Technical Verdict: HOLD (wait & see)
- RSI at 70.4 and Stochastic %K/%D at 88.8/90.2 show the stock is overbought, so upside may be harder to extend immediately.
- MACD remains positive with the line above the signal and a 4.998 histogram, so the trend is still intact even if stretched.
- Price above SMA20 and SMA50 supports the uptrend, but %B at 91% and price near resistance suggest limited short-term room without a fresh push.
- Verdict invalidated if price breaks below 1,453.40, because that would weaken the current range structure and signal a more serious loss of trend support.
- Ideal Entry Range: 1,506.98 to 1,453.40
- Exit Target (Target Price): 1,587.00 to 1,604.60
- Stop Loss protection: below 1,453.40
For non-traders, this means HSBC is still trending higher, but the stock is already near the top of its recent range and may need a pause before showing its next move.
HSBC’s last close was 1,576.00 GBp, just below resistance at 1,587.00.
Summary Data HSBC
| Last price | 1,576.00 GBp |
| Change 1 day / 5 days / 1 month | -0.69% / 1.49% / 8.61% |
| Trend / MA-cross | uptrend / none |
| SMA20 / SMA50 | 1,506.98 / 1,443.04 |
| RSI (14) / Stochastic %K | 70.4 / 88.8 |
| Bollinger %B / ATR | 91% / 39.69 |
| Support / Resistance 20 days | 1,453.40 / 1,587.00 |
| Data as of | 31 Juli 2026 14:00 WIB |


