HSBC Stock Gains 2.25% Today, RSI Overbought
On Agustus 3, 2026: price 168.20 HKD, trend uptrend, RSI 79.7, support 151.90, resistance 168.20. technical analysis of hsbc stock. HSBC Stock Gains — full…

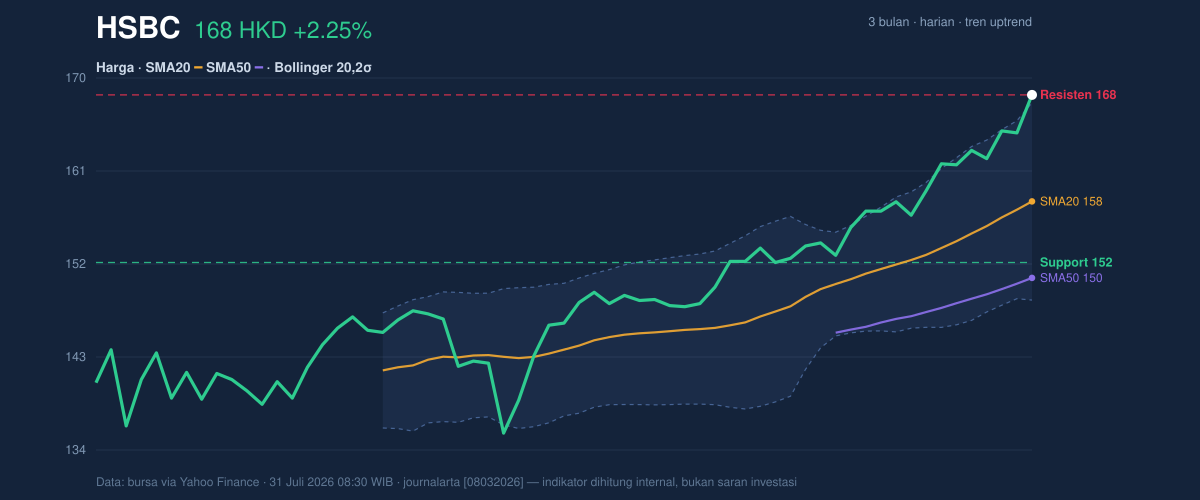
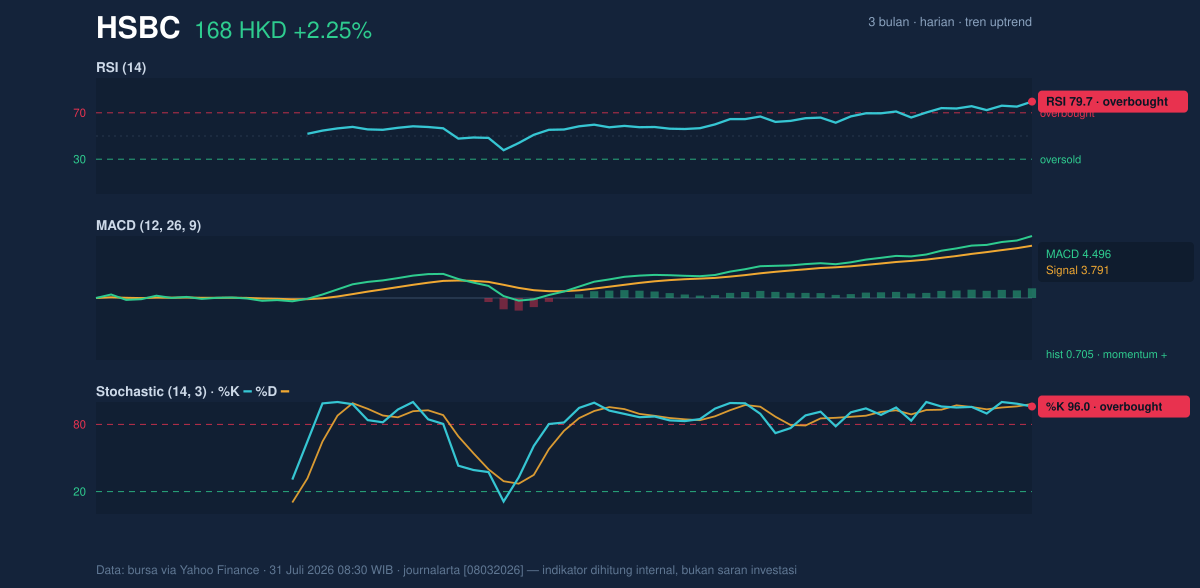
HKEX-listed HSBC Holdings closed at HKD 168.20, up from the previous close of HKD 164.50, and the move pushed the shares to the very top of their 20-session range. The stock is now trading above the SMA20 at HKD 157.84 and above the SMA50 at HKD 150.40, a positioning that confirms the broader trend is still pointing higher. But the chart also shows a more crowded setup: RSI at 79.7 and Stochastic %K 96.0 / %D 98.2 both sit in overbought territory, meaning the rally has extended far enough that momentum may be vulnerable to a pause even while the trend remains intact.
Trend & Price Action
The price structure is still constructive. HSBC’s 1-day gain of 2.25%, 5-day rise of 4.21%, and 1-month advance of 10.66% show that the move is not just a one-session burst but part of a broader climb. The SMA20 slope of 2.52% over 5 days signals the short-term trend is rising, while the fact that price remains above both the SMA20 and SMA50 tells traders that the market is still paying up for the shares rather than fading them. There has been no new MA-cross, so this is not a fresh crossover story; instead, it is a continuation phase in which the existing uptrend is being extended. As shown in the chart, the latest price is pressing against the upper edge of the recent band rather than sitting comfortably in the middle of it.
The important detail is where the stock sits inside its own range: HKD 168.20 is also the 20-session resistance, which means the market has already tested the ceiling and is now trading at it. That often signals strength, but it also means the margin for error is thin. When a stock reaches the top of its recent range, the next move tends to be more sensitive to fresh buying or any sign of exhaustion.
Oscillators & Momentum
The momentum indicators are aligned with the uptrend, but they are also flashing caution. MACD at 4.496 is above its signal line at 3.791, and the histogram at 0.705 remains positive. In plain English, that means the trend is still being reinforced by momentum rather than fading from beneath. The problem is not weakness; it is distance. The stock has run far enough that the faster indicators are now stretched.
RSI at 79.7 is above the usual overbought threshold, which does not automatically mean reversal, but it does mean the market has become enthusiastic enough that further upside may need a pause or consolidation to reset. The Stochastic %K at 96.0 and %D at 98.2 tell a similar story: price is closing near the top of its recent range, and that is exactly what strong momentum looks like near the end of a push. The signal here is not “trend broken”; it is “trend extended.” As shown in the chart, price momentum is still positive, but short-term conditions are overheated.
Volatility & Volume
Volatility is present, but not disruptive. The ATR(14) at 2.90, equal to 1.7% of price, suggests normal day-to-day movement rather than a disorderly spike. The Bollinger band width of 12.2% is described as normal, which means the stock is not in a volatility squeeze that often precedes a breakout, nor is it in a panic expansion that usually signals forced repositioning. Yet the price at %B 104% sits above the upper band at HKD 167.44, showing the shares have moved beyond the statistically expected range. That can happen in strong trends, but it also means the current price is running ahead of the band structure and may need to cool off before it can extend cleanly.
Volume supports the move. The latest turnover of 21,451,778 is about 1.6× the 20-session average of 13,454,169, and OBV is rising. That combination matters because it shows the rally is not just drifting higher on thin participation; buyers are actually showing up. In technical analysis, rising volume with a rising price usually confirms conviction. The short punchline: this advance has participation behind it.
Key Levels & Scenarios
The nearest support is HKD 151.90, which also sits close to the SMA20 at HKD 157.84 and the Bollinger middle band at the same level. That zone is important because it marks the area where the stock would start to look more like a normal pullback than a trend failure. On the upside, the immediate barrier is HKD 168.20, with the 3-month high at HKD 168.90 just above it. A clean move through that area would open the way into fresh high territory, but until that happens, the stock is effectively testing the top of its recent map.
If the price holds above HKD 168.20, the chart suggests continuation pressure can remain in place because momentum and volume are still supportive. If it fails to hold HKD 151.90, the tone would shift from extended uptrend to a more serious retracement, especially with the oscillators already overbought. The key distinction is whether the market can convert the current overbought condition into a breakout, or whether it needs to digest gains first.
Technical Verdict: HOLD (wait & see)
HOLD (wait & see) — the trend is still up, but the stock is stretched.
- RSI at 79.7 and Stochastic %K/%D at 96.0/98.2 show overbought conditions, which raises the odds of a pause.
- MACD at 4.496 above signal 3.791 and rising OBV confirm momentum and participation are still positive.
- Price at HKD 168.20 is sitting at 20-session resistance and above the upper Bollinger band at HKD 167.44, so the share price is extended rather than comfortably trending.
Verdict invalidated if price breaks below HKD 151.90, because that would weaken the current support structure and put the short-term trend under pressure.
- Ideal Entry Range: HKD 157.84 to HKD 151.90
- Exit Target: HKD 168.90
- Stop Loss Protection: below HKD 151.90
In plain English, HSBC is still trending higher, but the chart says the move is already stretched and may need to cool before it can go further.
Summary Data HSBC
| Last price | 168.20 HKD |
| Change 1 day / 5 days / 1 month | 2.25% / 4.21% / 10.66% |
| Trend / MA-cross | uptrend / none |
| SMA20 / SMA50 | 157.84 / 150.40 |
| RSI (14) / Stochastic %K | 79.7 / 96.0 |
| Bollinger %B / ATR | 104% / 2.90 |
| Support / Resistance 20 days | 151.90 / 168.20 |
| Data as of | 31 Juli 2026 08:30 WIB |


