OCBC Stock Technicals Today: Gains 0.10%, Momentum Weakens
On Agustus 3, 2026: price 29.13 SGD, trend uptrend, RSI 67.6, support 25.49, resistance 29.78. technical analysis of ocbc stock. OCBC Stock Technicals — full…

OCBC Bank’s shares on SGX were little changed at SGD 29.13, up 0.10% from the previous close, but the more important signal is that the stock is still trading near the top of its recent range, with the price sitting at 85% of the 20-session band. That positioning matters because it shows buyers have kept control for most of the past month, even though some momentum gauges are beginning to cool. As shown in the chart, the name remains in an uptrend, but the latest reading is less about acceleration and more about whether the move can hold together above nearby support.
Trend & Price Action
The broader structure is constructive. OCBC is trading above its SMA20 at SGD 28.26 and well above its SMA50 at SGD 25.82, which tells investors the medium-term trend is still pointing higher. The gap between those two averages is also wide enough to suggest the advance is not a short-lived bounce. In plain terms, the stock has already done the hard work of climbing back above its recent mean and staying there.
The slope of the SMA20, at 3.96% over 5 days, reinforces that message. A rising short-term average usually means the market is willing to pay up for the shares, and the latest price action confirms that willingness. Yet the stock is also close to resistance: the 20-session resistance at SGD 29.78 and the 3-month high at SGD 29.78 are the same level, which makes that zone especially important. That is the ceiling the market has not yet broken through.
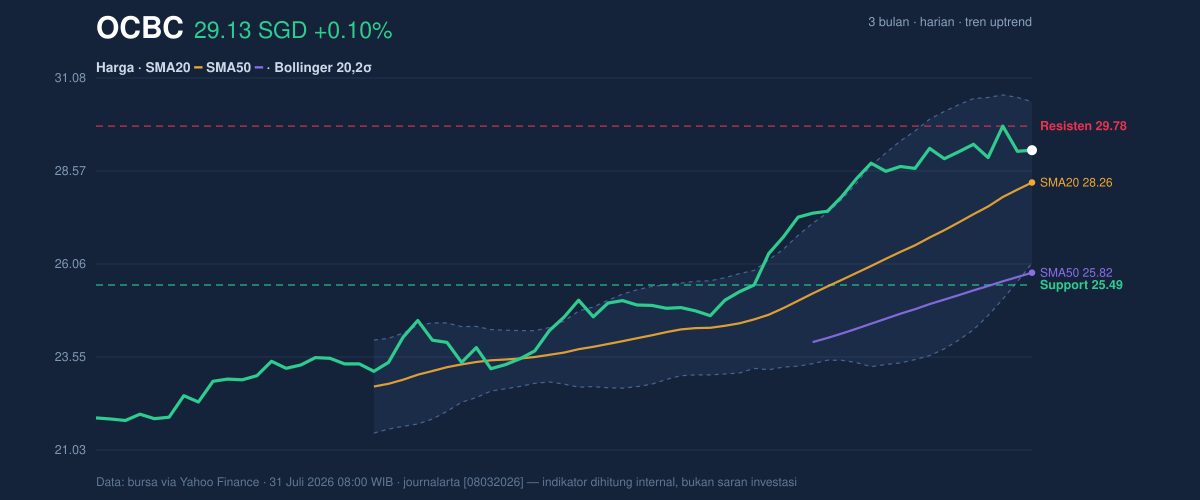
The Bollinger Band setup adds a useful nuance. The stock is trading with %B at 70%, meaning the price is in the upper portion of the band structure but not at the extreme edge. The band width is 15.4%, described as normal, so this is not a squeeze waiting to explode; it is a steady trend environment where price can still drift higher or stall without warning. In other words, the chart is not screaming breakout, but it is also not showing a breakdown pattern.
Oscillators & Momentum
The momentum picture is more mixed than the trend picture. RSI at 67.6 sits in neutral territory, although it is close enough to the upper zone to suggest the stock is no longer early in its move. RSI near 70 often signals a market that has become extended, but here it is better read as “firm, yet not overheated.” The Stochastic %K at 75.1 and %D at 83.0 also point to a stock that has spent time near the top of its short-term range. That usually means upside has been strong, but the pace may be slowing.
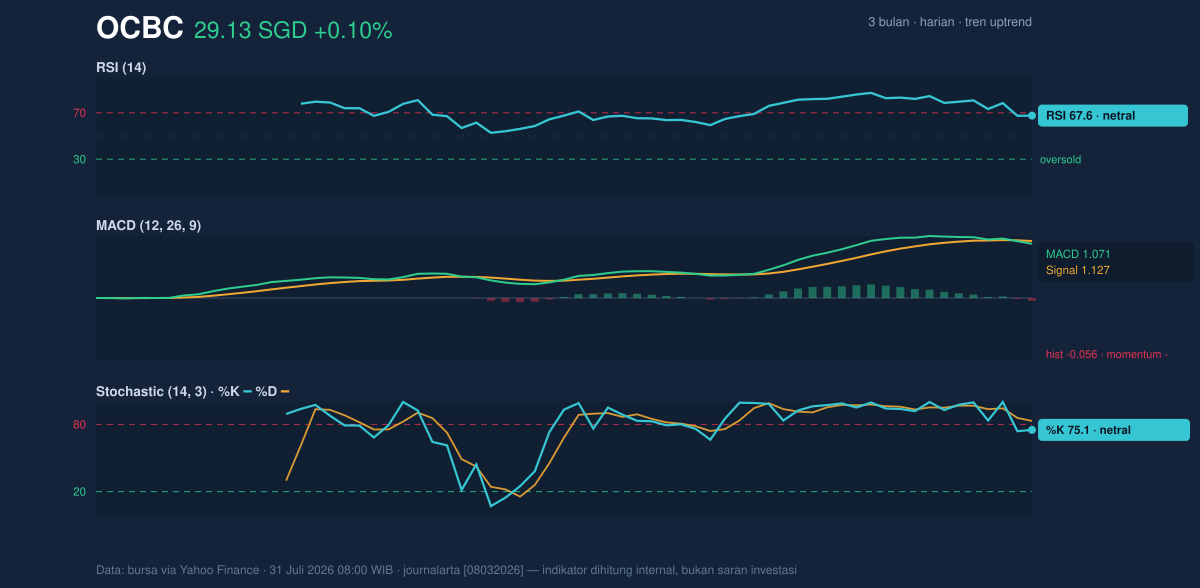
The key caution comes from MACD. The MACD at 1.071 is still positive, which means the trend has not broken, but it is below the signal line at 1.127, and the histogram at -0.056 shows momentum is turning slightly negative. This is not a bearish reversal by itself. It is, however, a warning that the stock’s upward push is losing a little force even as price remains elevated. When MACD slips below its signal line while price is still near highs, traders often watch for either a pause or a renewed push through resistance.
Volatility & Volume
Volatility is moderate rather than explosive. The ATR(14) at 0.61, equal to 2.1% of price, suggests the stock can move, but not in a wildly unstable way. That gives the chart room to breathe around support and resistance, and it also means a move through the current ceiling could unfold without needing a dramatic surge in daily range.
Volume offers a modest confirmation. The latest turnover of 7,061,400 was about 1.1× the 20-session average of 6,717,195, which indicates participation was a touch above normal. More importantly, OBV is rising, and that matters because on-balance volume tracks whether money is broadly flowing into the stock over time. Rising OBV alongside an uptrend usually means the advance is being supported by accumulation rather than a thin, speculative lift.
Key Levels & Scenarios
The immediate battle line is clear. Above the market, SGD 29.78 is the key resistance and the 3-month high. A clean move through that zone would tell readers that the stock is no longer just holding its gains, but is trying to extend the trend into new territory. Below the market, SGD 25.49 is the 20-session support and the first level to watch if sentiment weakens. That support sits well below the current price, so the market has room to absorb normal noise, but a failure there would change the tone sharply.
The Bollinger midpoint at SGD 28.26 also matters. It is both the SMA20 and the band center, so it acts as a practical line between a healthy trend and a more fragile one. If price starts losing that area, the chart would look less like a controlled advance and more like a range-bound pause.
Technical Verdict: HOLD (wait & see)
HOLD (wait & see)
- The trend is still positive because price is above the SMA20 and SMA50, and OBV is rising.
- Momentum is no longer fully aligned: MACD is below its signal line and the histogram is negative, which hints at slowing upside force.
- Price is close to SGD 29.78 resistance, so the chart needs confirmation before it can show fresh directional conviction.
Verdict invalidated if price falls below SGD 25.49, the 20-session support.
- Ideal Entry Range: around SGD 28.26 to SGD 29.13, where the stock is still above the trend base but not chasing a breakout.
- Exit Target: SGD 29.78, the current resistance and 3-month high.
- Stop Loss protection: below SGD 25.49, where the near-term support would have failed.
For non-traders, this means OCBC is still in an uptrend, but the stock is pausing near a ceiling and waiting for either a breakout or a pullback.
Summary Data OCBC
| Last price | 29.13 SGD |
| Change 1 day / 5 days / 1 month | 0.10% / 0.14% / 15.09% |
| Trend / MA-cross | uptrend / none |
| SMA20 / SMA50 | 28.26 / 25.82 |
| RSI (14) / Stochastic %K | 67.6 / 75.1 |
| Bollinger %B / ATR | 70% / 0.61 |
| Support / Resistance 20 days | 25.49 / 29.78 |
| Data as of | 31 Juli 2026 08:00 WIB |


