Shell Golden Cross Formed: Stock Gains 1.94% (Agustus 3, 2026)
On Agustus 3, 2026: price 3,383.50 GBp, trend uptrend, RSI 67.6, support 2,912.50, resistance 3,383.50. technical analysis of shell stock.

Shell plc extended its advance on the LSE, with the shares trading at 3,383.50 GBp as of 31 July 2026 14:00 WIB, up from the previous close of 3,319.00. The move matters because it was not just a one-day bounce: the stock has gained 1.94% in the session, 2.36% over five days and 17.02% in a month, placing Shell firmly among the market’s stronger large-cap energy names. The chart shows a market that is being pulled higher by trend, but one that is now pressing into the upper edge of its recent range, where momentum often becomes more selective.
Trend & Price Action
Shell remains in a clearly defined uptrend, helped by a golden cross — the point where the 20-day moving average rises above the 50-day moving average — which is usually read as a medium-term bullish shift in market structure. The shares are also trading above the SMA20 at 3,190.85 and the SMA50 at 3,126.25, showing that buyers have been willing to pay up above both the short- and medium-term average prices. That positioning is important because it suggests the recent rise is not a brief spike, but part of a broader improvement in trend quality. The slope of the SMA20, up 3.30% over five days, reinforces that message, as shown in the chart.
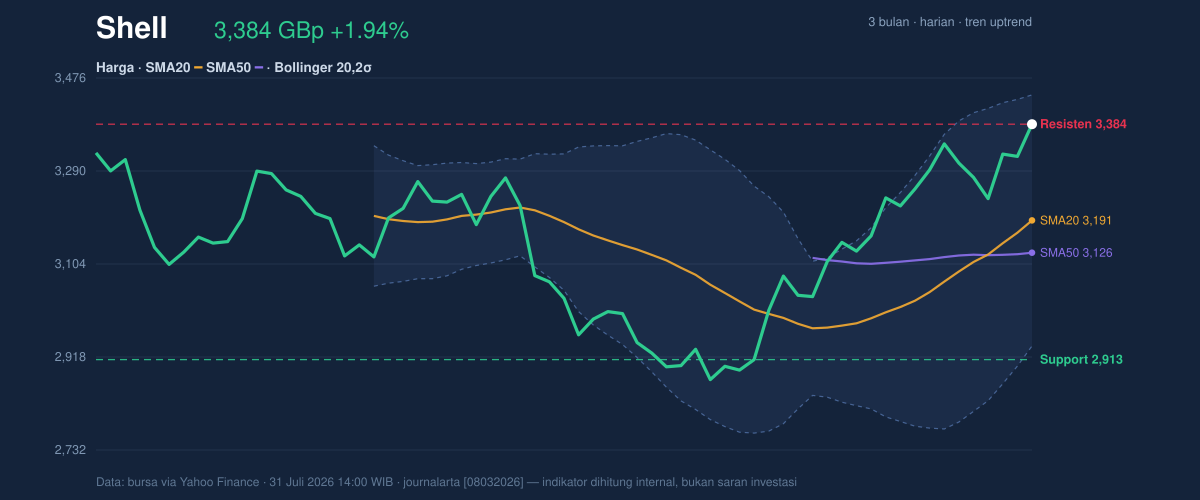
The catch is that Shell is now sitting at 100% of its 20-day range, with resistance at 3,383.50 matching the latest price exactly. That tells traders the stock is testing the top of the near-term corridor rather than moving through open air. The broader three-month range, from 2,559.50 to 3,758.50, shows there is still room before the prior peak, but the immediate question is whether the current move can escape the short-range ceiling without losing momentum.
Oscillators & Momentum
The momentum picture is mixed, and that is often what one sees when a stock is strong but no longer cheap. RSI at 67.6 is still described as neutral in this dataset, but it is close to the conventional overbought zone, which means the rally has become extended without yet flashing a hard reversal warning. By contrast, Stochastic %K at 96.6 and %D at 94.2 are clearly overbought, signalling that the share price has risen faster than the recent pace of underlying buying. In plain English, the stock is not necessarily turning down, but it is stretched.
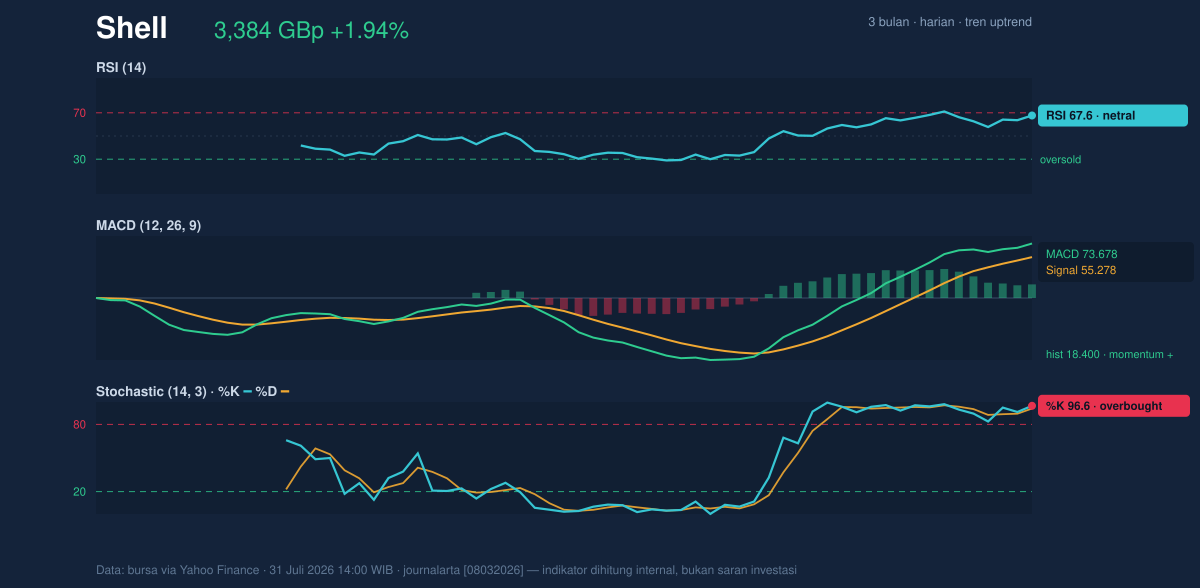
The more constructive element is MACD at 73.678 versus its signal line at 55.278, with a positive histogram of 18.400. MACD measures whether upward momentum is accelerating or fading, and here it is still leaning firmly positive. That combination — an overbought stochastic reading alongside a positive MACD — usually means the trend remains intact, but fresh upside may need either a pause or a breakout to keep going. It is a classic “strong, but extended” setup.
Volatility & Volume
Volatility is present, but not disorderly. The ATR of 103.93, equal to 3.1% of price, points to moderate daily movement, so the stock can still travel meaningfully without being erratic. Bollinger Bands add another layer: with the upper band at 3,442.00, the middle band at 3,190.85 and the lower band at 2,939.70, Shell is trading near the upper band with %B at 88%. That reading means price is near the top of its recent volatility envelope, often a sign of strength — but also of limited immediate upside unless volume expands.
The volume backdrop is less emphatic than the price action. Last volume was 8,122,577, below the 20-day average of 9,000,314, or about 0.9x normal. That matters because a breakout above resistance is usually more convincing when participation rises with it. Still, OBV is rising, which suggests the cumulative balance of volume has been supportive even if the latest session did not come with a surge in turnover. In other words, the market has been accepting higher prices, but not yet with a dramatic crowd effect.
Key Levels & Scenarios
The immediate battle is between the current price and the nearby ceiling. Resistance at 3,383.50 is the first level to watch because the stock is already there. Above that, the Bollinger upper band at 3,442.00 becomes the next technical reference, while the broader swing high at 3,758.50 marks the upper end of the three-month range. On the downside, the first meaningful cushion is the SMA20 at 3,190.85, followed by the SMA50 at 3,126.25 and then the lower Bollinger band at 2,939.70. If the price slips back below the short-term average, it would suggest the current surge is cooling rather than building into a new leg higher.
Technical Verdict: HOLD (wait & see)
HOLD (wait & see)
- Golden cross and price above both SMA20 and SMA50 support the broader uptrend.
- MACD is positive, which confirms momentum is still constructive.
- Stochastic is overbought and price is already at resistance 3,383.50, so near-term upside looks stretched.
Verdict invalidated if price falls below 3,190.85, the SMA20 and Bollinger middle band.
- Ideal entry range: 3,190.85 to 3,126.25
- Exit target: 3,442.00
- Stop loss protection: 2,939.70
For non-traders, this means Shell’s trend is still healthy, but the share price is close to a technical ceiling and may need a pause before the next move. “It’s strong, but it’s getting expensive to chase right here,” one London trader said.
Summary Data Shell
| Last price | 3,383.50 GBp |
| Change 1 day / 5 days / 1 month | 1.94% / 2.36% / 17.02% |
| Trend / MA-cross | uptrend / golden |
| SMA20 / SMA50 | 3,190.85 / 3,126.25 |
| RSI (14) / Stochastic %K | 67.6 / 96.6 |
| Bollinger %B / ATR | 88% / 103.93 |
| Support / Resistance 20 days | 2,912.50 / 3,383.50 |
| Data as of | 31 Juli 2026 14:00 WIB |


