Singtel Golden Cross Formed: Stock Drops 3.06% (Agustus 3, 2026)
On Agustus 3, 2026: price 4.44 SGD, trend uptrend, RSI 49.5, support 4.37, resistance 4.61. technical analysis of singtel stock. Singtel Golden Cross Formed —…

Singapore Telecom’s Singtel slipped to SGD 4.44 on SGX in Singapore, down 3.06% from the previous close of SGD 4.58, even as the shares remained in an established uptrend. The move matters because it came with price still sitting above both the SMA20 at 4.44 and the SMA50 at 4.40, while the chart’s moving-average structure has already printed a golden cross, a signal that usually means the shorter-term trend has overtaken the longer-term one. As shown in the chart, the immediate question is not whether the trend exists, but whether the pullback is simply testing it.
Trend & Price Action
The stock is trading in the upper half of its recent structure, but not at the top of it. With the price at SGD 4.44 and the 20-hour support-resistance band running from SGD 4.37 to SGD 4.61, Singtel is positioned at roughly 29% of that range, which tells traders the market is closer to support than resistance. That placement is important because it suggests the latest drop has not yet damaged the broader trend; instead, it looks like a cooling-off phase inside a rising pattern.
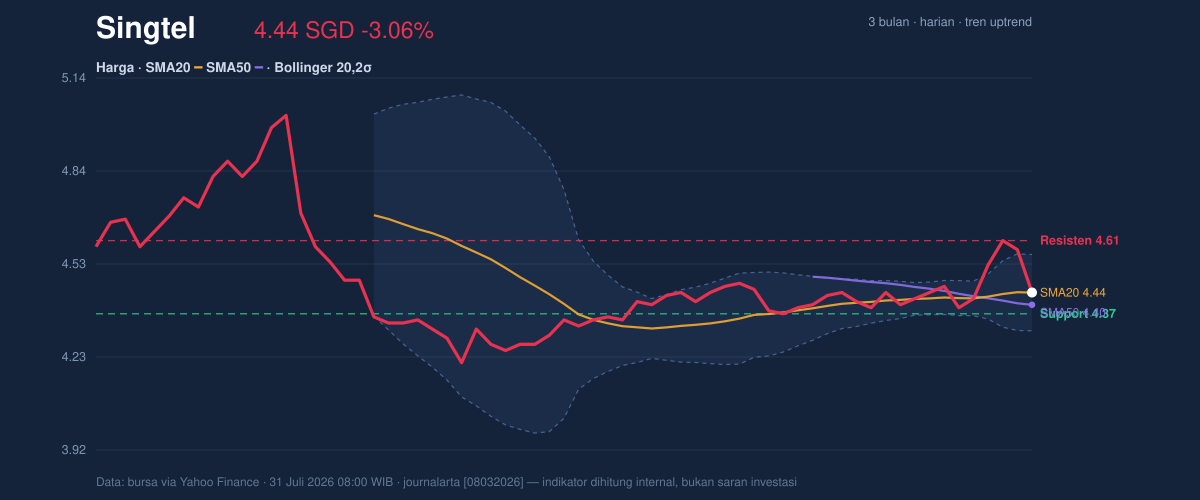
The Bollinger bands reinforce that reading. The middle band sits at SGD 4.44, the upper band at SGD 4.56, and the lower band at SGD 4.31. Price at the centre line means the market is neither stretched to the upside nor washed out to the downside. More importantly, the band width is only 5.6%, which signals a squeeze — a narrow range that often precedes a sharper move once the stock leaves the compression zone. In plain language, the market is storing energy rather than spending it.
Singtel is also trading above the 3-month low of 4.15 and below the 3-month high of 5.05, leaving room on both sides. That matters because the stock has not yet reclaimed its recent peak, but it has also stayed comfortably away from the lower end of the range. For a large defensive telecom name, that kind of mid-range positioning usually points to consolidation rather than panic.
Oscillators & Momentum
The momentum picture is less dramatic than the trend picture, and that is often the most useful combination. The RSI at 49.5 is neutral, which means the stock is not overbought and not oversold. That neutral reading is consistent with a market that has paused after a recent advance rather than one that is breaking down. The Stochastic %K at 25.7 and %D at 63.8 are also neutral, but the gap between the two lines shows short-term momentum has cooled faster than the broader trend.
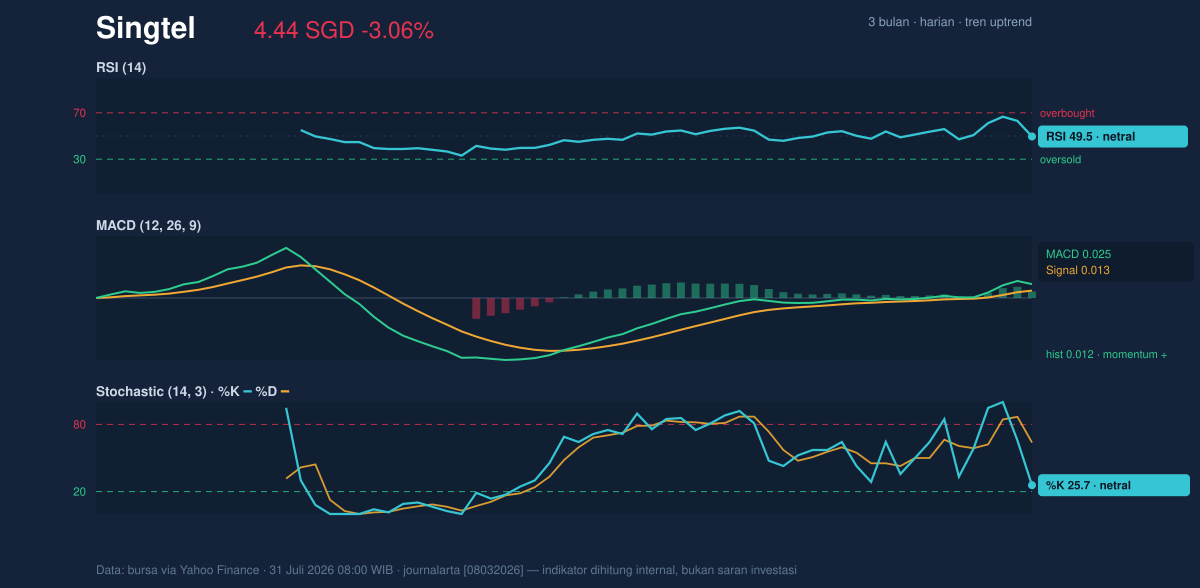
The more constructive signal comes from the MACD at 0.025, above its signal line at 0.013, with a positive histogram of 0.012. MACD crossing and holding above the signal line usually means upside momentum still exists under the surface, even when price action looks hesitant. In this case, the indicator is telling a clearer story than the oscillators: the stock is not accelerating, but it has not flipped into a bearish momentum regime either.
That mix — neutral RSI, softer Stochastic, but positive MACD — often appears when a stock is digesting gains. It does not guarantee a fresh rally, yet it does suggest the pullback has not been strong enough to erase the underlying bid.
Volatility & Volume
Trading activity adds a useful layer of confirmation. Last volume was 29,996,600, just 0.9x the 20-day average of 31,621,265. That means the decline was not driven by a surge in selling pressure. When price falls on below-average volume, the message is usually that conviction is limited; sellers are active, but not dominant enough to force a broader breakdown.
The OBV is rising, which is another constructive clue. On-balance volume tracks whether volume is flowing into the stock or out of it, so a rising OBV while price is consolidating often means accumulation is still present beneath the surface. ATR adds context: at 0.09, or 2.1% of price, volatility is moderate. That fits the squeeze in the Bollinger bands and suggests the next meaningful move could come relatively quickly once the range resolves.
Key Levels & Scenarios
The market is now watching the same levels from both sides. SGD 4.37 is the first support that matters, because a clean hold there would keep the recent structure intact. Below that, the Bollinger lower band at SGD 4.31 becomes the next technical floor. On the upside, SGD 4.56 is the first band-related hurdle, while SGD 4.61 is the more important resistance from the recent range.
If Singtel pushes above SGD 4.61, the chart would signal that the squeeze is resolving to the upside and that buyers are willing to pay through the top of the range. If it fails to hold SGD 4.37, the current constructive setup weakens and the market would likely revisit the lower band around SGD 4.31.
Technical Verdict: HOLD (wait & see)
HOLD (wait & see)
- Golden cross and price above the SMA20/SMA50 keep the broader structure constructive.
- MACD is positive, which says momentum has not fully rolled over.
- Bollinger bands are squeezing, so the next move may be meaningful, but direction is not yet confirmed by RSI 49.5 or Stochastic 25.7/63.8.
Verdict invalidated if price breaks below SGD 4.37.
- Ideal entry range: SGD 4.37 to SGD 4.44
- Exit target: SGD 4.56 to SGD 4.61
- Stop loss protection: below SGD 4.31
In plain English: the chart still leans constructive, but the stock has not yet proved that it can break out of its current pause.
Summary Data Singtel
| Last price | 4.44 SGD |
| Change 1 day / 5 days / 1 month | -3.06% / 1.14% / -0.67% |
| Trend / MA-cross | uptrend / golden |
| SMA20 / SMA50 | 4.44 / 4.40 |
| RSI (14) / Stochastic %K | 49.5 / 25.7 |
| Bollinger %B / ATR | 50% / 0.09 |
| Support / Resistance 20 days | 4.37 / 4.61 |
| Data as of | 31 Juli 2026 08:00 WIB |

