Tencent Stock Gains 0.72%, Momentum Gains In Focus
On Agustus 3, 2026: price 475.20 HKD, trend uptrend, RSI 57.2, support 434.60, resistance 484.00. technical analysis of tencent stock. Tencent Stock Gains —…

Tencent Holdings advanced on HKEX in Hong Kong on 31 July 2026, with shares last changing hands at 475.20 HKD, up 0.72% on the day, as the stock extended a short-term climb that has already delivered 9.34% over five days and 10.20% over one month. The move matters less as a headline gain than as evidence that buyers have kept Tencent above its short-term trend line: the price is trading above the SMA20 at 461.55 and well clear of the SMA50 at 449.76, which tells the market the recent rebound is still being accepted rather than faded.
Trend & Price Action
The chart shows Tencent sitting in an established uptrend, with the SMA20 rising at 1.99% over five days. That slope is important: a rising moving average means recent prices are being pulled higher, not merely bouncing on one-off news. The lack of a fresh MA-cross is also constructive in a different way. It suggests this is not a dramatic trend reversal that needs a new signal to validate it; instead, the stock is already operating above both major short-term averages, which usually reflects steady accumulation rather than a panic-driven snapback.
The current price is also positioned near the upper end of its recent trading band, at about 82% of the 20-hour range. That placement says momentum has been strong enough to keep Tencent closer to resistance than support, but it also means the stock is no longer cheap within its own recent channel.
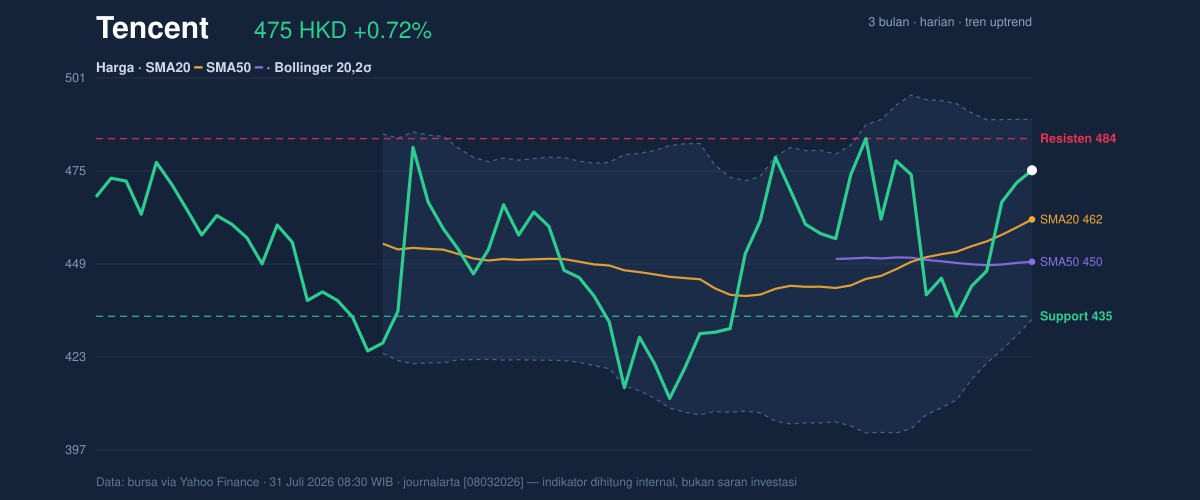
The key reference points on the chart are clear: support at 434.60, resistance at 484.00, and the upper Bollinger band at 489.39. Tencent is now approaching the zone where prior advances have started to meet supply. In plain English, the stock has room to continue climbing, but it is also entering an area where traders who bought lower may be tempted to lock in gains.
Short and sharp: the trend is up, but the next ceiling is close.
Oscillators & Momentum
The momentum picture is supportive, though not euphoric. The RSI at 57.2 sits in neutral territory, which is a useful sign because it implies Tencent is not yet stretched into overbought conditions. That leaves some breathing room for the trend to continue without immediately triggering exhaustion signals. The Stochastic %K at 68.8 and %D at 62.3 also remain neutral, with %K above %D — a mild positive read that points to near-term strength, but not the kind of sharp acceleration that typically accompanies a breakout.
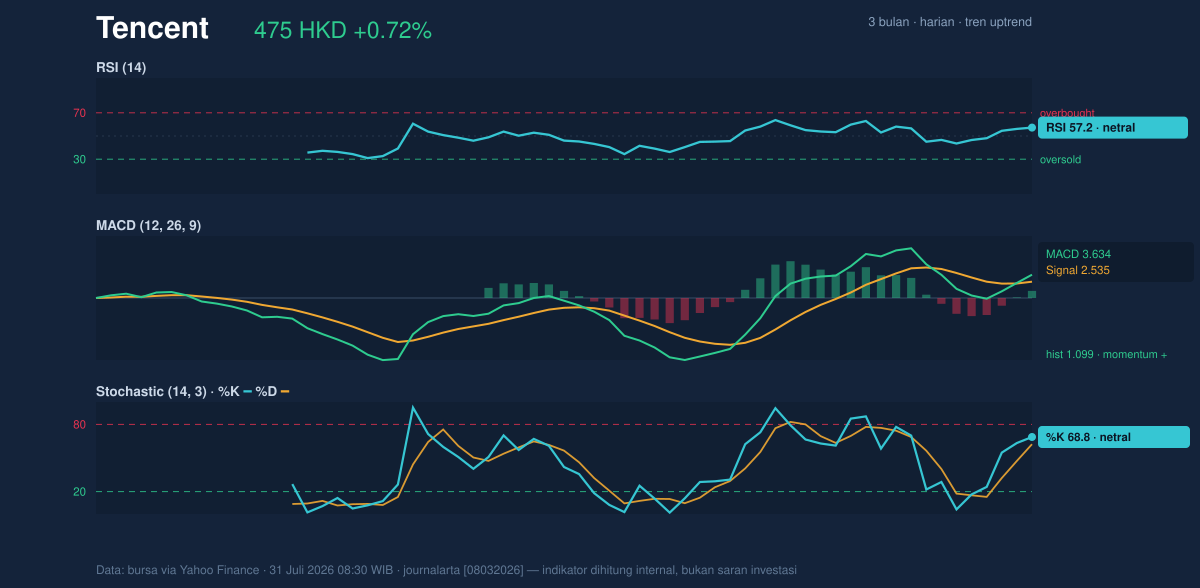
The more decisive signal comes from MACD. Tencent’s MACD at 3.634 is above its signal line at 2.535, with a positive histogram of 1.099. That combination means the recent price trend is still outperforming its own medium-term baseline. Put simply, the stock is not just rising; it is rising with internal momentum still intact. The absence of an overbought RSI while MACD remains positive is a constructive mix, because it suggests strength without obvious overheating.
Volatility & Volume
Tencent’s volatility profile is more active than the daily percentage move alone might suggest. The ATR(14) at 17.66, equal to 3.7% of price, indicates a high-volatility environment. ATR measures the average daily trading range, so this reading means swings of meaningful size are normal here; the stock can travel quickly once it leaves its current band. That matters because a move toward resistance may not be smooth — it may come in bursts.
The Bollinger Bands reinforce that point. The band width is 12.1%, described as normal, which means the stock is not in a squeeze, but neither is it in an extreme expansion phase. Tencent is trading at a %B of 75%, which places it in the upper portion of the band structure without reaching the top edge. That usually signals strength, but also warns that upside is becoming more limited unless buyers can force a clean push through resistance.
Volume was a touch softer than average, at 31,100,240 versus a 20-hour average of 34,742,577, or 0.9× normal. That is the one caution flag in the tape. Price rose, but participation did not fully expand with it. Still, OBV is rising, which means the broader volume trend has been supportive even if this session was not a breakout on heavy turnover. In market terms, the stock is advancing on acceptable participation, but not yet on the kind of surge that often confirms a decisive move through resistance.
Key Levels & Scenarios
The three-month range helps frame the battle. Tencent’s 3-month high is 494.80, while the 3-month low is 411.00. The stock is now closer to the top of that range than the bottom, which is a sign of regained confidence after a weaker phase. The immediate question is whether it can clear 484.00 and then challenge the 489.39 upper Bollinger band. If it does, the market will likely start testing the 494.80 area, where the recent highs sit.
If the stock fails to hold the 461.55 SMA20, the tone changes quickly. A break back below that level would suggest the current advance is losing traction and that the move is reverting to its mean. Below that, 449.76 becomes the next important floor, because it is the SMA50 and a more meaningful gauge of whether the medium-term trend is still intact. The deeper structural support remains 434.60; losing that zone would point to a more serious deterioration in the chart.
Technical Verdict: HOLD (wait & see)
HOLD (wait & see)
- MACD is positive and still above its signal line, which supports the current uptrend.
- Price is above the SMA20 and SMA50, confirming the broader short-term structure remains constructive.
- RSI and Stochastic are neutral, while price sits near the upper part of its range, so the chart is healthy but not yet offering a low-risk breakout signal.
- Verdict invalidated if price falls below 461.55, which would put the stock back under the SMA20 and weaken the current trend.
- Ideal Entry Range: 461.55 to 449.76
- Exit Target: 484.00 to 489.39
- Stop Loss protection: 434.60
For non-traders, this means Tencent still looks technically firm, but the chart is close enough to resistance that the next move needs confirmation rather than assumption.
“The stock is strong, but it has reached the part of the chart where strength has to prove itself.”
Summary Data Tencent
| Last price | 475.20 HKD |
| Change 1 day / 5 days / 1 month | 0.72% / 9.34% / 10.20% |
| Trend / MA-cross | uptrend / none |
| SMA20 / SMA50 | 461.55 / 449.76 |
| RSI (14) / Stochastic %K | 57.2 / 68.8 |
| Bollinger %B / ATR | 75% / 17.66 |
| Support / Resistance 20 days | 434.60 / 484.00 |
| Data as of | 31 Juli 2026 08:30 WIB |


