Testing Key Resistance, Alibaba Stock Gains 4.65% Today
On Agustus 3, 2026: price 117.00 HKD, trend sideways, RSI 59.0, support 95.80, resistance 117.00. technical analysis of alibaba stock. Testing Key Resistance —…

Alibaba Group’s Hong Kong-listed shares rose to 117.00 HKD on Thursday, up 4.65% from the previous close of 111.80, as the stock pushed to the top of its recent trading range on the Hong Kong exchange. The move matters because it was not just a one-day bounce: the shares are up 6.36% over 5 days and 24.34% over 1 month, a pattern that suggests buyers have been willing to pay higher prices even though the broader chart still reads as sideways. That combination — a rising share price inside a range-bound structure — is often where traders look for confirmation rather than assuming a clean trend has already formed.
Trend & Price Action
The chart shows Alibaba trading above its SMA20 at 110.98 and above its SMA50 at 111.61, which tells readers that the shorter-term price is now sitting above both its recent and medium-term averages. In plain terms, that is constructive: when price holds above both averages, it usually means the market is no longer treating those levels as overhead resistance. But the broader trend label remains sideways, and that is important. A sideways market does not mean directionless; it means the stock is still working through a range, with rallies needing confirmation before they can be read as a more durable shift.
The lack of a new MA-cross also tempers the signal. A moving-average cross is when a shorter average moves above or below a longer one, often used as a rough trend-change marker. Since there is no fresh cross, the chart is improving, but not yet giving the cleanest trend-break signal.
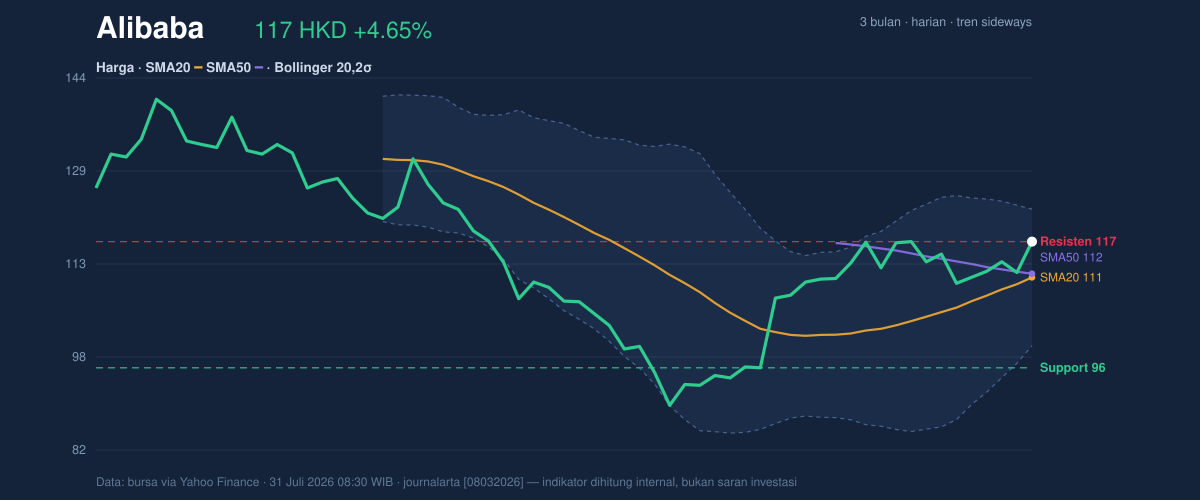
The price is also sitting at 100% of the 20-hour range, with 20-hour resistance at 117.00 and 20-hour support at 95.80. That means the stock is pressing right against the ceiling of its recent trading band. When price reaches the top of its range, the market is effectively asking whether the move has enough fuel to extend — or whether it will pause and digest gains first.
Oscillators & Momentum
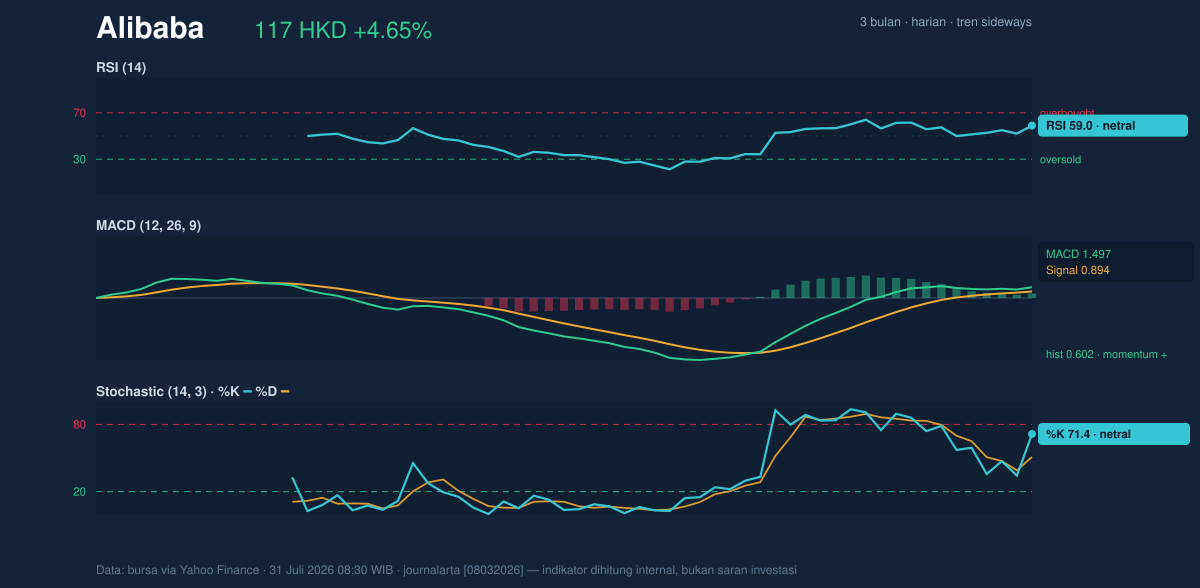
Momentum indicators are supportive, but not overheated. The RSI at 59.0 is neutral, which suggests Alibaba is not yet in classic overbought territory even after the recent climb. That is a useful signal: it leaves room for further upside without immediately implying exhaustion. The Stochastic %K at 71.4 and %D at 51.0 are also neutral, but the gap between the two lines shows short-term momentum is firmer than the broader smoothing line. In practical terms, this often means the stock has been improving faster than the oscillator’s slower average, a sign of strengthening pressure rather than a fully stretched move.
The clearest momentum message comes from the MACD. The MACD at 1.497 is above the signal line at 0.894, with a histogram of 0.602, which points to positive momentum. The histogram is especially useful because it shows the distance between the MACD line and its signal line; a positive reading means bullish momentum is still expanding. That does not guarantee continuation, but it does confirm the recent rise is being backed by trend energy rather than a purely mechanical bounce.
Volatility & Volume
Volatility is elevated, and the chart says the market is expecting movement, not calm. Alibaba’s Bollinger Bands are wide, with the upper band at 122.46, the middle band at 110.98, and the lower band at 99.49. The %B of 76% shows price is trading in the upper part of the band structure, which is another way of saying the stock is relatively elevated within its recent volatility envelope. A band width of 20.7% and an ATR of 5.30 — about 4.5% of price — both indicate high volatility. ATR, or average true range, is a measure of typical daily movement; at this level, traders should expect wider swings than a low-volatility stock would normally produce.
Volume strengthens the move. Last session volume was 144,668,807, above the 20-hour average of 115,103,669, or 1.3× normal. That matters because price moves on thin volume can fade quickly, while higher participation suggests more market conviction. The fact that OBV is rising reinforces that idea: on-balance volume tracks whether volume is flowing into up days or down days, and a rising line typically means buyers are doing enough business to support the advance.
Key Levels & Scenarios
The immediate technical map is straightforward. The nearest ceiling is the 117.00 resistance marked by the 20-hour range high, while the first major volatility reference above that is the 122.46 Bollinger upper band. On the downside, the first meaningful support sits at the 110.98 SMA20, then the 111.61 SMA50, with deeper support at 99.49 on the Bollinger lower band and 95.80 on the 20-hour range floor.
If price can hold above the moving averages and continue to close near the upper Bollinger zone, the chart would be signaling that the recent rebound is being accepted by the market. If it fails to stay above 110.98, the move would start to look more like a range pop than a trend shift. A break below 95.80 would invalidate the near-term constructive setup and shift attention back toward the lower band at 99.49.
Technical Verdict: HOLD (wait & see)
HOLD (wait & see) fits best because the chart is improving, but not yet clean enough to call a full trend reversal.
- MACD is positive, with the line above the signal and a positive histogram, which supports the recent advance.
- Price is above SMA20 and SMA50, showing the stock has reclaimed key short- and medium-term averages.
- Bollinger Bands are widening and ATR is high, so the stock has room to move but also a meaningful risk of sharp swings near resistance.
Verdict invalidated if price falls below 95.80.
- Ideal Entry Range: 110.98 to 111.61, where the SMA20 and SMA50 sit.
- Exit Target: 122.46, the upper Bollinger Band.
- Stop Loss Protection: 95.80, the 20-hour support floor.
In plain English: the chart is leaning better, but it still needs to prove it can stay above its nearby support before the move looks durable.
The 3-month high is 144.00.
Summary Data Alibaba
| Last price | 117.00 HKD |
| Change 1 day / 5 days / 1 month | 4.65% / 6.36% / 24.34% |
| Trend / MA-cross | sideways / none |
| SMA20 / SMA50 | 110.98 / 111.61 |
| RSI (14) / Stochastic %K | 59.0 / 71.4 |
| Bollinger %B / ATR | 76% / 5.30 |
| Support / Resistance 20 days | 95.80 / 117.00 |
| Data as of | 31 Juli 2026 08:30 WIB |


