AIA Stock Analysis: Drops 1.38%, Testing Key Resistance
On Agustus 4, 2026: price 78.55 HKD, trend sideways, RSI 62.5, support 72.30, resistance 79.65. technical analysis of aia stock. AIA Stock Analysis — full…

AIA Group’s shares slipped to 78.55 HKD in Hong Kong trading, down 1.38% from the previous close of 79.65 HKD, even as the stock remains up 7.24% over the past month. The move leaves the insurer trading above its short-term averages but still below the top of its recent range, a pattern that suggests the market is not rejecting the trend, only testing how far it can stretch before momentum cools.
Trend & Price Action
The broader setup is still constructive, but not unchallenged. AIA is trading above both its SMA20 at 75.94 HKD and SMA50 at 76.41 HKD, which usually signals that buyers have kept control of the intermediate trend. The chart also shows no fresh MA cross, so there is no new moving-average breakout to reinforce the move. That matters because the stock is not accelerating from a new technical trigger; it is advancing within an established band.
The slope of the SMA20 at 2.18% over 5 days points upward, but the overall trend is still described as sideways. In plain language, that means the stock has enough support to avoid looking weak, yet not enough directional force to be called a clean breakout. It is sitting near the upper end of its short-term range, with the 20-hour resistance at 79.65 HKD close overhead and the 20-hour support at 72.30 HKD still well below. As shown in the chart, the price is already at 85% of its range, which leaves less room for easy upside unless buyers can push through the ceiling.
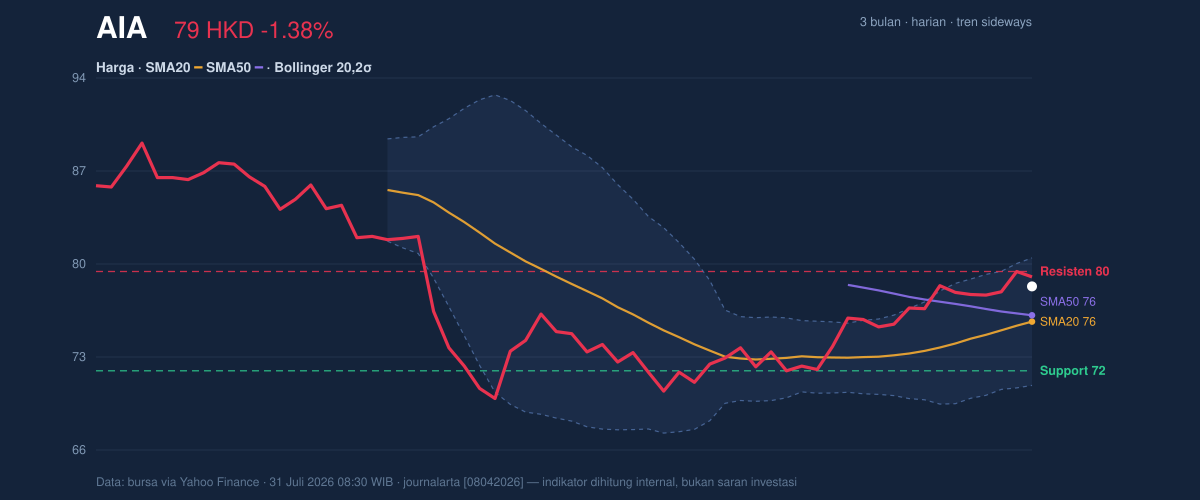
The broader three-month frame gives that position more context. AIA is still below the 3-month high of 89.95 HKD, but comfortably above the 3-month low of 69.05 HKD. That positioning says the stock has repaired much of its earlier weakness, though it has not yet proven that the recovery can extend into a new leg higher.
Oscillators & Momentum
Momentum is mixed, and the mix is important. The RSI at 62.5 is neutral-to-firm, which means the stock has positive energy without being stretched enough to scream exhaustion. That is the kind of reading that often accompanies a healthy trend, but it does not guarantee continuation.
The more cautionary signal comes from stochastics. The Stochastic %K at 89.0 and %D at 90.4 are both in overbought territory, which usually means the stock has risen quickly relative to recent trading and may need to pause or consolidate. Overbought does not automatically mean a reversal; it often means the market has become crowded on the upside and is more sensitive to any disappointment. As shown in the momentum chart, that is the main reason the recent climb looks mature rather than fresh.
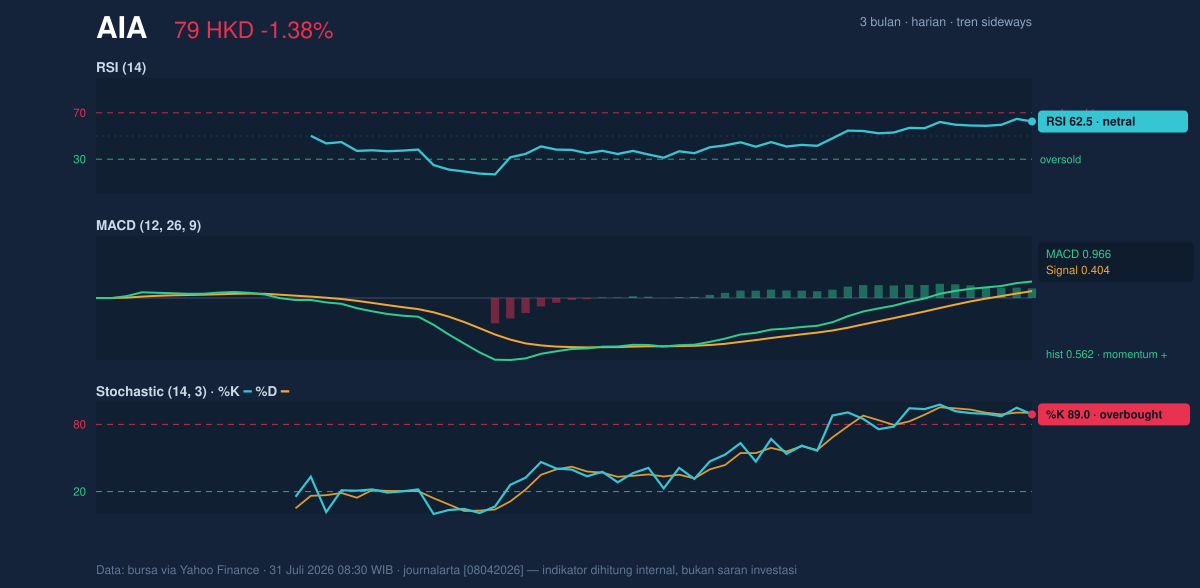
The MACD at 0.966, above its signal line at 0.404, keeps the momentum case positive. The histogram at 0.562 shows the spread remains in favor of the trend, which means underlying price pressure is still upward even if the short-term oscillator is overheated. Put simply, MACD says the trend is still alive; stochastics say it may be getting tired near the top of the range. That combination often leads to sideways trading rather than an immediate reversal.
Volatility & Volume
Volatility is moderate, not extreme. The ATR at 1.88 HKD, or 2.4% of price, suggests the stock is capable of moving, but not in a disorderly way. That matters because a stock near resistance with moderate volatility can still break higher, but it usually needs either stronger participation or a clearer catalyst.
The Bollinger setup also points to a market that is firm but not stretched beyond control. The upper band at 80.66 HKD sits just above the current price, while the middle band at 75.94 HKD lines up with the SMA20. The %B at 78% shows price is trading in the upper part of the band, a sign of strength, while the Bollinger width of 12.4% indicates a normal volatility regime rather than a squeeze or explosive expansion. In other words, the stock has room to move, but the chart is not signaling an imminent volatility shock.
Volume is a more nuanced read. Last trading volume was 27,134,663, above the 20-hour average of 22,696,613, or about 1.2x normal. That confirms participation in the move, which is constructive. But OBV is falling, and that divergence matters. OBV, or on-balance volume, tracks whether volume is supporting price direction. A falling OBV while price holds up suggests the rally is not being broadly confirmed by accumulation. It is a warning that the advance may be narrower than the price alone implies.
Key Levels & Scenarios
The nearest technical test is straightforward: 79.65 HKD is the immediate resistance to watch, while 75.94 HKD is the first meaningful support from the moving-average and Bollinger middle band. If the stock can clear 80.66 HKD, the upper Bollinger band, it would show that buyers are willing to pay up beyond the current upper range. If it fails there, the chart points back toward the 75.94 HKD area, where trend support should be tested.
A break below 72.30 HKD would be more serious. That level is the 20-hour support and the lower boundary of the recent trading structure, so losing it would suggest the sideways pattern is resolving lower rather than higher. The 69.05 HKD three-month low would then become the next obvious reference point.
Technical Verdict: HOLD (wait & see)
HOLD (wait & see)
- MACD remains positive, with the line above signal and a positive histogram, so trend momentum has not broken.
- Stochastic is overbought, which argues for caution near resistance rather than chasing strength.
- OBV is falling, so volume confirmation is weaker than the price action suggests.
Verdict invalidated if price falls below 72.30 HKD.
- Ideal Entry Range: 75.94 HKD to 76.41 HKD
- Exit Target: 79.65 HKD to 80.66 HKD
- Stop Loss protection: below 72.30 HKD
For non-traders, this means the stock still looks technically healthy, but it is close enough to resistance and overbought enough on short-term momentum that patience matters more than urgency.
Summary Data AIA
| Last price | 78.55 HKD |
| Change 1 day / 5 days / 1 month | -1.38% / 0.58% / 7.24% |
| Trend / MA-cross | sideways / none |
| SMA20 / SMA50 | 75.94 / 76.41 |
| RSI (14) / Stochastic %K | 62.5 / 89.0 |
| Bollinger %B / ATR | 78% / 1.88 |
| Support / Resistance 20 days | 72.30 / 79.65 |
| Data as of | 31 Juli 2026 08:30 WIB |

