Death Cross Pressure, AMD Stock Gains 7.00% Today
On Agustus 5, 2026: price 518.58 USD, trend sideways, RSI 52.4, support 429.56, resistance 557.89. technical analysis of amd stock. Death Cross Pressure — full…

Internationally, AMD is trading in a market where price strength is still visible, but the chart is warning that momentum has not fully caught up.
Advanced Micro Devices closed at 518.58 USD, up 7.00% on the day and 14.07% over five days, according to data from Yahoo Finance via the exchange feed. That is a sharp rebound in the short term, yet the bigger message from the chart is more cautious: the stock is still in a sideways trend, and the SMA20 has crossed below the SMA50, a so-called death cross that often signals fading medium-term momentum even when the latest price move looks strong.
Trend & Price Action
[HARGA-GRAFIK]
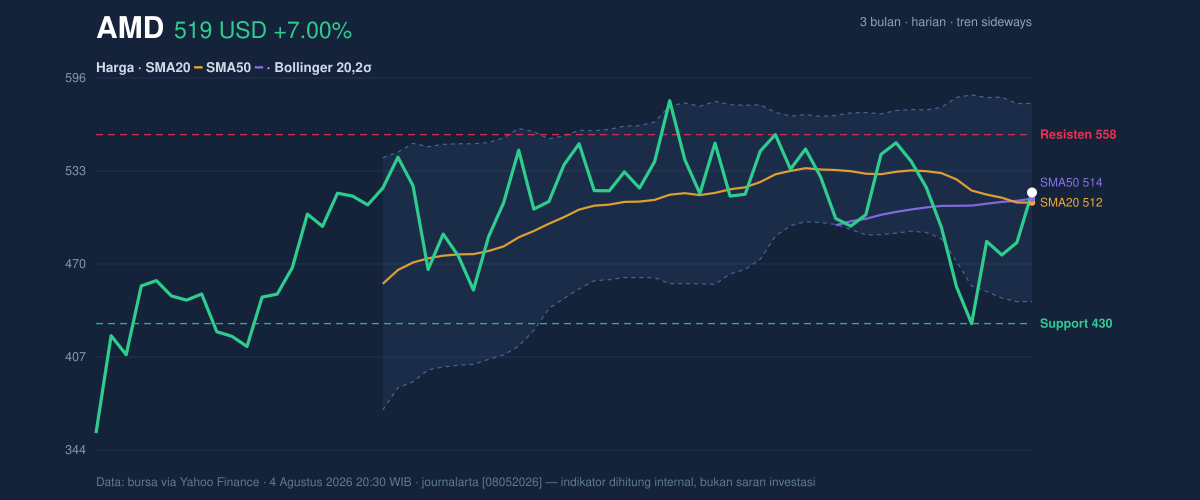
The last price sits above the SMA20 at 511.81 and above the SMA50 at 514.33, which means AMD has reclaimed both short-term and medium-term trend lines for now. That matters because traders often treat those averages as a rough line between recovery and weakness. But the slope of the SMA20 is still -2.97% over five days, so the average itself is drifting lower even as the stock bounces. In plain terms, the recent surge has improved the tape, but it has not yet erased the down-tilt in the trend structure.
The price also sits at about 69% of its 20-hour range, between 429.56 support and 557.89 resistance. That positioning suggests the stock is leaning toward the upper half of its recent band, but not yet testing the ceiling. The 3-month high of 584.73 remains close enough to matter, while the 3-month low of 344.88 shows how wide the swing has been. This is not a sleepy chart; it is a market still trying to decide whether the rebound is a reset or a reversal.
The Bollinger Bands reinforce that uncertainty. AMD is trading inside a band system with upper resistance at 579.05, middle at 511.81, and lower at 444.57. The price is near the middle line, and %B at 55% means it is slightly above the midpoint of the band rather than stretched to an extreme. The key signal is the 26.3% band width, which shows the bands are expanding. Wider bands usually mean the market is pricing in bigger swings ahead, not calm consolidation.
Oscillators & Momentum
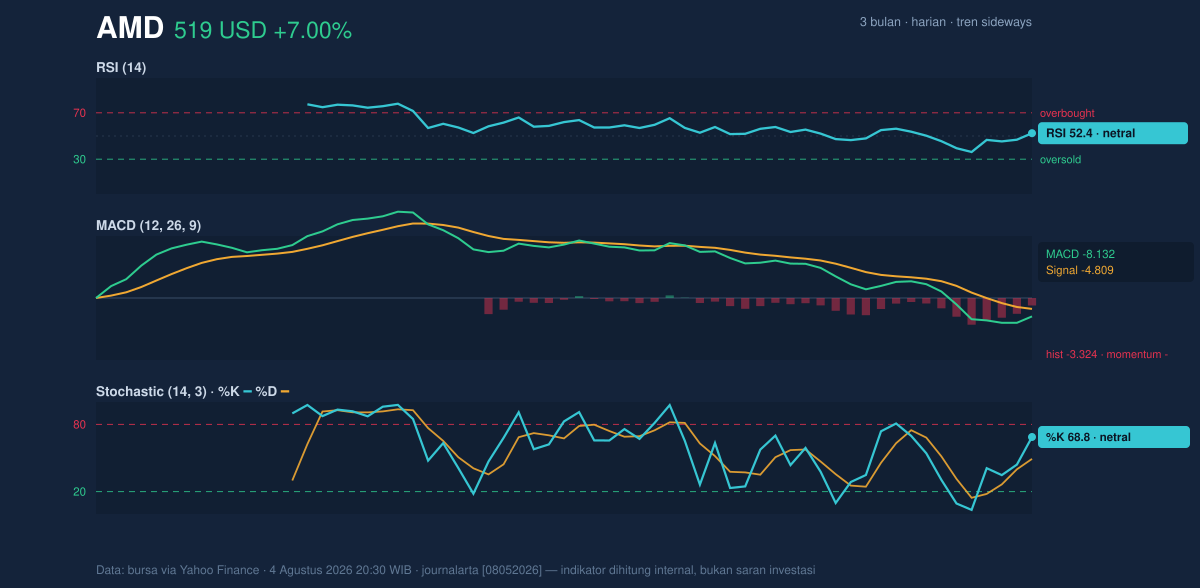
Momentum is mixed, and that is the most important nuance in AMD right now. The RSI at 52.4 is neutral, which means the stock is neither overbought nor oversold. The Stochastic %K at 68.8 and %D at 49.2 also point to a market that has recovered but has not yet reached the kind of stretched condition that often precedes an easy pullback. In other words, the oscillators are not screaming “panic” or “euphoria”; they are saying the bounce has room, but not conviction.
The harder warning comes from MACD. AMD’s MACD is -8.132, below its signal line at -4.809, with a negative histogram of -3.324. That combination means the short-term trend remains weaker than the longer-term trend, even after the latest price jump. For readers unfamiliar with the term, MACD is a momentum gauge that compares two moving averages; when it is below the signal line and the histogram is negative, it usually means downside pressure is still dominating beneath the surface. So while price has improved, momentum has not yet fully confirmed the move.
Volatility & Volume
The volume picture adds weight to the rebound. Last session volume was 47,385,900, versus a 20-hour average of 28,498,395, or about 1.7x normal activity. That is a meaningful participation spike, and it suggests the move was not made by a thin market. Still, the OBV is falling, which is a cautionary divergence. OBV, or on-balance volume, tries to measure whether volume is flowing into the stock on up days or out of it on down days. A falling OBV tells us the broader accumulation trend has not yet turned decisively positive.
The ATR at 41.30, equal to 8.0% of price, confirms that AMD is in a high-volatility phase. ATR, or average true range, is a way of measuring how much a stock typically moves in a session. A reading this elevated means price can travel quickly in either direction, so the market is not offering much stability even after the recent gain. Combined with the widening Bollinger Bands, the setup argues for larger-than-usual swings rather than a smooth climb.
Key Levels & Scenarios
The immediate technical map is clear. Support at 429.56 is the lower boundary that would matter if the rebound fails. On the upside, resistance at 557.89 is the first test, while 579.05 is the Bollinger upper band and 584.73 is the 3-month high that could act as a stronger ceiling. If AMD clears 557.89 and holds above it, the chart would show stronger acceptance of the rebound. If it fails there, the stock risks slipping back toward the middle of the band near 511.81 or lower.
The most useful reading is that AMD is no longer in obvious short-term breakdown mode, but it is also not in clean trend-confirmation mode. Price is above the moving averages, yet the death cross, negative MACD, and falling OBV all say the burden of proof remains on the bulls.
Technical Verdict: HOLD (wait & see)
HOLD (wait & see)
- Why: price is holding above SMA20 and SMA50, which supports the rebound.
- Why: RSI 52.4 and Stochastic 68.8/49.2 are neutral, so the move is not yet overextended.
- Why: MACD is negative and OBV is falling, which means momentum confirmation is still missing.
- Verdict invalidated if price falls below 429.56, the stated support level.
- Ideal Entry Range: 511.81 to 514.33, near the middle of the recent structure and the moving averages.
- Exit Target: 557.89, with 579.05 as the higher technical ceiling from the Bollinger band.
- Stop Loss protection: below 429.56, where the recent range floor sits.
For non-traders, this means AMD has bounced hard, but the chart still wants proof that the recovery is real. “The stock is shouting, but the momentum is still whispering.”
Summary Data AMD
| Last price | 518.58 USD |
| Change 1 day / 5 days / 1 month | 7.00% / 14.07% / 0.48% |
| Trend / MA-cross | sideways / death |
| SMA20 / SMA50 | 511.81 / 514.33 |
| RSI (14) / Stochastic %K | 52.4 / 68.8 |
| Bollinger %B / ATR | 55% / 41.30 |
| Support / Resistance 20 days | 429.56 / 557.89 |
| Data as of | 4 Agustus 2026 20:30 WIB |



